Crystallite Size Distribution of Zinc Oxide Nanoparticles
Introduction
In recent years, there has been active research on purification of air and decomposition of water using photocatalysts. Oxide semiconductors in particular have the property of being resistant to change, even under punishing use conditions in air, and thus are regarded as a promising photocatalyst material. Among these materials, zinc oxide is attracting attention as an environmentally-friendly material with photocatalytic activity. However, despite the fact that it has a 3.37 eV bandgap, it exhibits photocatalytic action in response to visible light, and its distinctive surface texture and crystallite size are thought to be intimately involved with that effect.
Measurements and Results
X-ray diffraction patterns were measured for zinc oxide powder heat treated in oxygen for 1 hour at 400°C, 500°C, 600°C, 700°C and 800°C. To determine the crystallite size distribution, analysis was carried out using the 110 diffraction line, which has high diffraction intensity, and no overlap with other diffraction lines. Figure 1 shows the 110 diffraction line at each temperature used for analysis, overlaid with the simulation profile. Increasing the treatment temperature narrows the diffraction line width, and thus, qualitatively speaking, the crystallite size was found to be large. Figure 2 shows the crystallite size distribution analyzed using these peaks. The left graph of Figure 2 shows the crystallite count distribution, and the right graph shows the crystallite volume distribution. These show the ratio of number and volume to the diameter of each crystallite. It was found that, in both the crystallite count distribution and volume distribution, there is a tendency for crystallite size to increase and distributions to widen as the sample is treated at higher temperatures (1), (2).
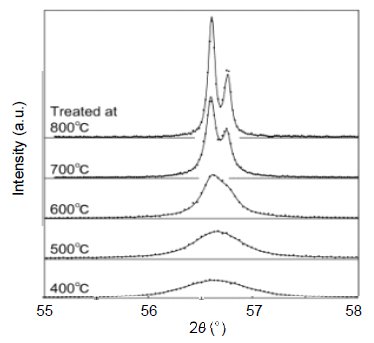 Figure 1: X-ray diffraction profile of zinc oxide nanocrystal (Solid line: simulation, • : actual measurements)
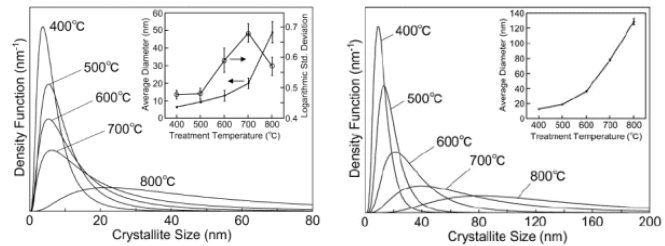 Figure 2: Analysis results for crystallite size distribution (left: crystallite count distribution, right: crystallite volume distribution)
References
(1) Konaka et al: Proceedings of the 5th Annual Meeting of the Society of Nano Science and Technology, 162, PS74. (in Japanese)
(2) Konaka et al: Jour. Flux Growth, 2, (2007), 41-44. (in Japanese)
Samples provided by: Professor Haga, Sendai National College of Technology, and Associate Professor Shishido, Tohoku University

Contact Us
Whether you're interested in getting a quote, want a demo, need technical support, or simply have a question, we're here to help.