Metals & Alloys
Scope
The semi-quantitative measurement of metals in various alloys is demonstrated using the Fundamental Parameters approach without the need for a reference library.
Background
Standard and specialty alloys vary in metal composition to give the alloy its specific physical, mechanical, and chemical properties. Analyzing alloy composition by XRF (X-ray Fluorescence) is important to ensure the proper alloy grade meets the needs for its specific use. The Rigaku NEX QC+ QuantEZ system gives the operator a quick, simple, and reliable means of checking alloy composition without damaging or changing the sample.
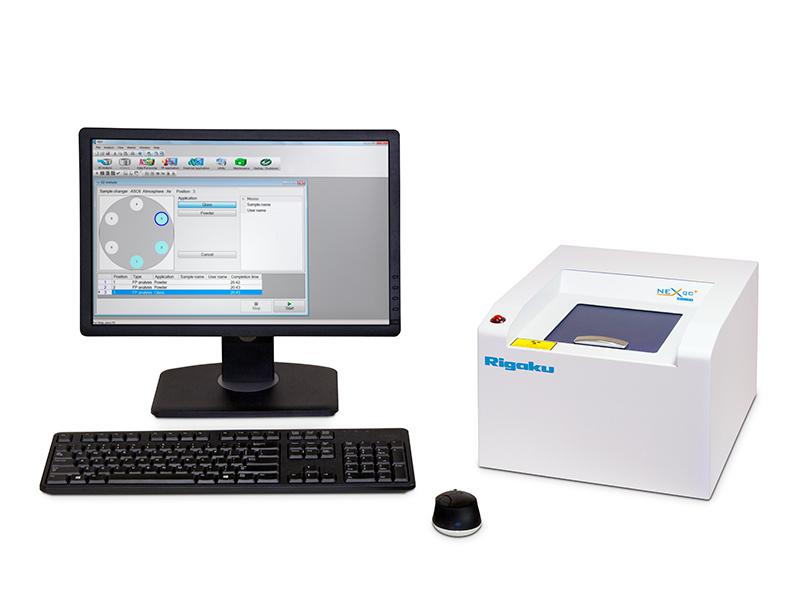 Model: NEX QC+ Quant-EZ
Results
| Sample: SS 303 Units: mass % |
|||
| Element | Specification range | NEX QC+ QuantEZ result | Statistical error |
| Fe | Balance | 68.8 | — |
| Cr | 17.0 – 19.0 | 19.3 | 0.025 |
| Ni | 8.0 – 10.0 | 7.35 | 0.014 |
| Mn | 2.0 max | 1.88 | 0.010 |
| Si | 1.0 max | 0.64 | 0.003 |
| Sample: SS 304 Units: mass % |
|||
| Element | Specification range | NEX QC+ QuantEZ result | Statistical error |
| Fe | Balance | 69.4 | — |
| Cr | 18.0 – 20.0 | 20.0 | 0.024 |
| Ni | 8.0 – 10.5 | 7.9 | 0.014 |
| Mn | 2.0 max | 1.00 | 0.009 |
| Si | 1.0 max | 0.69 | 0.003 |
| Sample: Al 7075 Units: mass % |
|||
| Element | Specification range | NEX QC+ QuantEZ result | Statistical error |
| Al | 87.1 – 91.4 | 92.4 | — |
| Cr | 0.18 – 0.28 | 0.24 | 0.002 |
| Cu | 1.2 – 2.0 | 1.18 | 0.002 |
| Fe | 0.5 max | 0.27 | 0.002 |
| Mg | 2.1 – 2.9 | ND* | — |
| Mn | 0.3 max | 0.03 | 0.001 |
| Si | 0.4 max | ND* | — |
| Ti | 0.2 max | 0.06 | 0.002 |
| Zn | 5.1 – 6.1 | 5.34 | 0.003 |
*Mg and Si at low levels are not detectable in an aluminum alloy due to aluminum absorption of Mg and Si X-rays
| Sample: MONEL Alloy K-500 Units: mass % |
|||
| Element | Specification range | NEX QC+ QuantEZresult | Statistical error |
| Ni | 63.0 min | 64.2 | — |
| Mn | 1.5 max | 0.84 | 0.006 |
| Fe | 2.0 max | 0.01 | 0.002 |
| Si | 0.5 max | 0.09 | 0.002 |
| Cu | 27.0 – 33.0 | 31.2 | 0.024 |
| Al | 2.30 – 3.15 | 2.77 | 0.012 |
| Ti | 0.35 – 0.85 | 0.60 | 0.009 |
| Sample: Hastelloy B-3 Units: mass % |
|||
| Element | Specification range | NEX QC+ QuantEZ result | Statistical error |
| Ni | 65.0 min | 64.9 | — |
| Cr | 1.0 – 3.0 | 1.83 | 0.016 |
| Mo | 27.0 – 32.0 | 27.8 | 0.017 |
| Mn | 1.0 max | 0.67 | 0.009 |
| Cu | 0.2 max | 0.50 | 0.010 |
| Si | 0.1 max | 0.43 | 0.006 |
| Ti | 0.2 max | ND* | — |
| Co | 3.0 max | ND* | — |
| V | 0.2 max | ND* | — |
| Fe | 1.0 – 3.0 | 1.64 | 0.009 |
*Trace levels of Ti and V and low levels of Co are not detectable in this alloy due to high levels of Ni and Mo that absorb transition metal X-rays
| Sample: Alloy R405 Units: mass % |
|||
| Element | Certified value | NEX QC+ QuantEZ result | Statistical error |
| Cu | 32.3 | 32.2 | 0.025 |
| Ni | 64.8 | 64.9 | — |
| Al | 0.08 | ND* | — |
| Fe | 1.31 | 1.37 | 0.005 |
| Mn | 1.03 | 1.14 | 0.006 |
| Si | 0.05 | ND* | — |
| Ti | 0.005 | ND* | — |
| Cr | 0.008 | ND* | — |
*Trace levels of Al, Si, Ti, and Cr are not detectable in this alloy due to high levels of Cu and Ni that absorb transition metal and light element X-rays
| Sample: CDA 544 Units: mass % | |||
| Element | Certified value | NEX QC+ QuantEZ result | Statistical error |
| Cu | 87.7 | 88.9 | — |
| Fe | 0.02 | ND* | — |
| Pb | 3.87 | 2.82 | 0.011 |
| Ni | 0.077 | ND* | — |
| Sn | 4.73 | 3.97 | 0.006 |
| Zn | 3.55 | 3.67 | 0.009 |
*Trace levels of Fe and Ni are not detectable in this alloy due to high levels of Cu that absorb transition metal X-rays
Conclusion
The NEX QC+ QuantEZ provides a rapid, non- destructive means for semi- quantitative measurement for screening, identification and other semi-quant needs without the need for a special library. To optimize the FP results for a specific family of alloys, the QuantEZ software also gives the user a simple way of creating a Matching Library using one more certified alloy sample of that family type, providing a fast and simple means to design libraries to fit exact analysis needs.

Contact Us
Whether you're interested in getting a quote, want a demo, need technical support, or simply have a question, we're here to help.