Minerals in Grass
Scope
The analysis of important mineral elements in grass is demonstrated.
Background
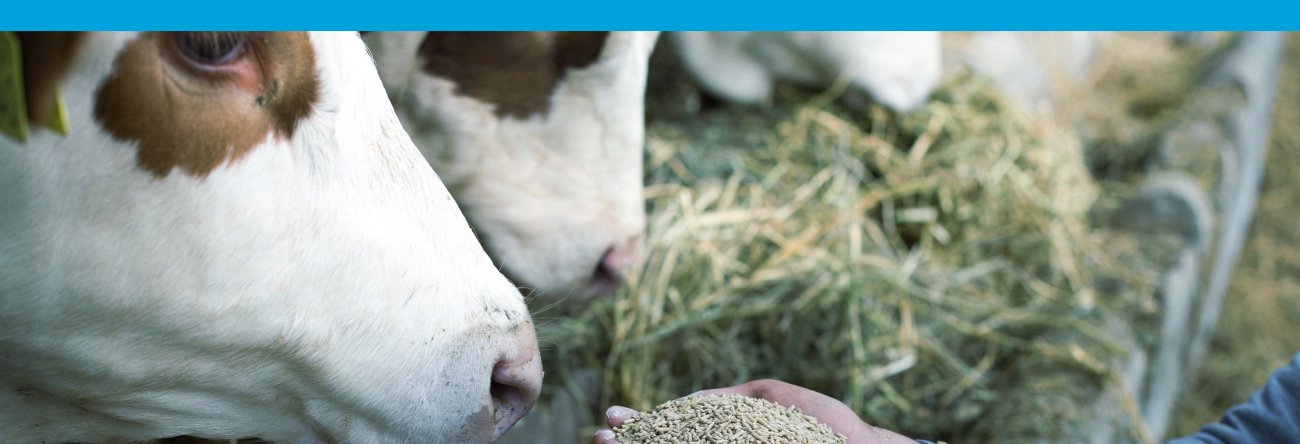
The mineral content of animal feeds is carefully blended and monitored to ensure optimal animal health and product quality. Grass-fed dairy cattle require the optimum balance of the major minerals calcium, potassium, magnesium, and phosphorus and the trace minerals copper, manganese, and zinc. Proper mineral balance ensures optimum milk quality and production. To meet the industry's need of monitoring the mineral content, Rigaku offers the NEX QC+ EDXRF analyzer for fast and simple measurement of grass and other animal feeds.
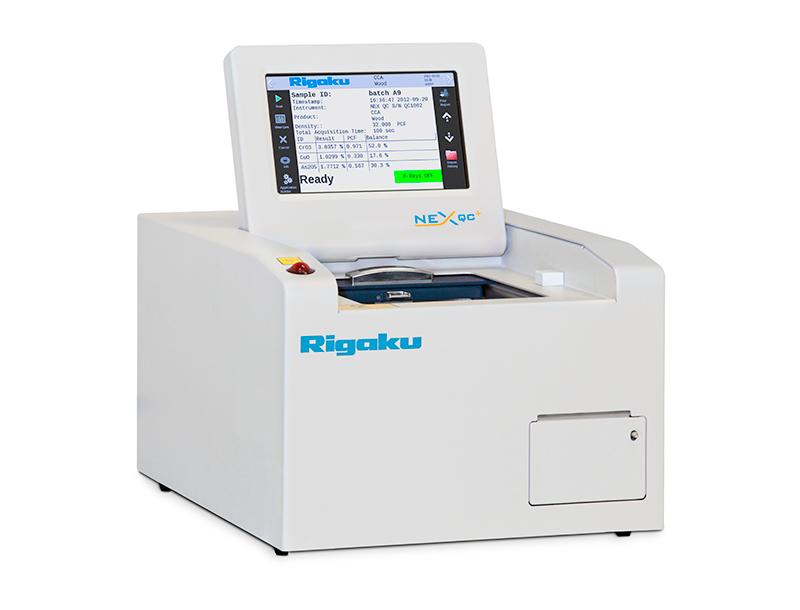 Model: NEX QC+
Calibration
A set of twelve assayed grass samples were submitted by an industry user for demonstration. Empirical regressions calibrations were built to provide optimum accuracy.
| Element | Units | Concentration range |
| K | % | 1.8 – 3.2 % |
| Ca | % | 0.4 – 0.8 % |
| Mg | % | 0.14 – 0.22 % |
| P | % | 0.22 – 0.32 % |
| S | % | 0.13 – 0.30 % |
| Mn | ppm | 45 – 105 ppm |
| Cu | ppm | 5 – 12 ppm |
| Zn | ppm | 20 – 50 ppm |
Note: 1 ppm = 1 mg/kg
Precision
Representative calibration standards were measured ten consecutive times each in a static position to demonstrate effective recovery and analytical precision.
| Sample I.D.: Standard #73 | |||
| Element | ICP value | NEX QC+ average value | Std. dev |
| K | 2.713 % | 2.738 % | 0.054 |
| Ca | 0.536 % | 0.540 % | 0.006 |
| Mg | 0.180 % | 0.163 % | 0.009 |
| P | 0.254 % | 0.249 % | 0.002 |
| S | 0.300 % | 0.288 % | 0.0005 |
| Mn | 105.6 ppm | 106.1 ppm | 1.5 |
| Cu | 11.9 ppm | 12.4 ppm | 0.7 |
| Zn | 47.0 ppm | 45.9 ppm | 0.9 |
| Sample I.D.: Standard #77 | |||
| Element | ICP value | NEX QC+ average value | Std. dev |
| K | 1.912 % | 1.947% | 0.026 |
| Ca | 0.836 % | 0.828 % | 0.007 |
| Mg | 0.222 % | 0.197 % | 0.002 |
| P | 0.341 % | 0.334 % | 0.001 |
| S | 0.125 % | 0.119 % | 0.0002 |
| Mn | 84.8 ppm | 85.6 ppm | 2.8 |
| Cu | 6.9 ppm | 7.3 ppm | 0.2 |
| Zn | 48.8 ppm | 49.5 ppm | 0.1 |
| Sample I.D.: Standard #79 | |||
| Element | ICP value | NEX QC+ Average value | Std. dev |
| K | 3.241 % | 3.199 % | 0.024 |
| Ca | 0.543 % | 0.533 % | 0.008 |
| Mg | 0.143 % | 0.131 % | 0.008 |
| P | 0.308 % | 0.302 % | 0.001 |
| S | 0.201 % | 0.195 % | 0.0011 |
| Mn | 31.0 ppm | 30.4 ppm | 1.5 |
| Cu | 10.9 ppm | 8.6 ppm | 0.5 |
| Zn | 21.2 ppm | 20.7 ppm | 0.5 |
| Sample I.D.: Standard #87 | |||
| Element | ICP value | NEX QC+ average value | Std. dev |
| K | 1.379 % | 1.440 % | 0.010 |
| Ca | 0.424 % | 0.431 % | 0.002 |
| Mg | 0.168 % | 0.142 % | 0.002 |
| P | 0.252 % | 0.244 % | 0.001 |
| S | 0.127 % | 0.124 % | 0.0004 |
| Mn | 73.4 ppm | 73.6 ppm | 0.8 |
| Cu | 5.7 ppm | 5.9 ppm | 0.2 |
| Zn | 23.1 ppm | 22.6 ppm | 0.3 |
Analysis of unknown samples
Unknown samples with ICP values were submitted by the user for measurement against the calibrations built. Results are shown here.
| Sample I.D.: Sample #76 | |||
| Element | ICP value | NEX QC+ average value | Std. dev |
| K | 2.508 % | 2.474 % | 0.026 |
| Ca | 0.652 % | 0.666 % | 0.002 |
| Mg | 0.169 % | 0.171 % | 0.001 |
| P | 0.288 % | 0.290 % | 0.0002 |
| S | 0.198 % | 0.197 % | 0.0005 |
| Mn | 36.7 | 37.5 | 2.1 |
| Cu | 7.8 | 8.5 | 0.2 |
| Zn | 30.5 | 30.6 | 0.4 |
| Sample I.D.: Sample #84 | |||
| Element | ICP value | NEX QC+ average value | Std. dev |
| K | 2.619 % | 2.580 % | 0.003 |
| Ca | 0.455 % | 0.477 % | 0.002 |
| Mg | 0.168 % | 0.175 % | 0.0048 |
| P | 0.315 % | 0.289 % | 0.001 |
| S | 0.259 % | 0.246 % | 0.0011 |
| Mn | 77.9 ppm | 75.2 ppm | 0.7 |
| Cu | 6.9 ppm | 7.0 ppm | 0.2 |
| Zn | 30.8 ppm | 31.7 ppm | 0.2 |
Conclusion
The NEX QC+ offers analysts a simple yet powerful and versatile system for quantifying elemental composition using the empirical approach. The results of this study indicate that given stable samples, proper sample handling, and proper calibration technique, the Rigaku NEX QC+ EDXRF can achieve excellent results for measuring the key mineral elements in grass and other animal feeds.

Contact Us
Whether you're interested in getting a quote, want a demo, need technical support, or simply have a question, we're here to help.