Analysis of Lube Oils

Scope
The measurement of phosphorus (P), sulfur (S), calcium (Ca), and zinc (Zn) in lube oil is demonstrated as per ASTM D6481.
Background
ASTM D6481 is a standard test method for measuring lube oil using EDXRF. The elements and concentration ranges covered by D6481 are specified in Table 1 of the method.
|
ASTM D6481-99 (2010) |
||
| Element | PLOQ in mass% | Max concentration in mass% |
| Phosphorus | 0.02 to 0.3 mass % | 0.10 |
| Sulfur | 0.05 to 1.0 mass % | 0.125 |
| Calcium | 0.02 to 1.0 mass % | 1.94 |
| Zinc | 0.01 to 0.3 mass % | 0.05 |
Quality control and quality assurance during the lube oil manufacturing process is essential, as various formulations give different lubricity properties. A fast, simple method of analyzing lube oils is important throughout the QC/QA process. Rigaku meets this industry need with a high-performance, low-cost benchtop EDXRF system. Rugged and reliable, the NEX QC+ is an ideal tool, with simple and intuitive software for the non-technical operator.
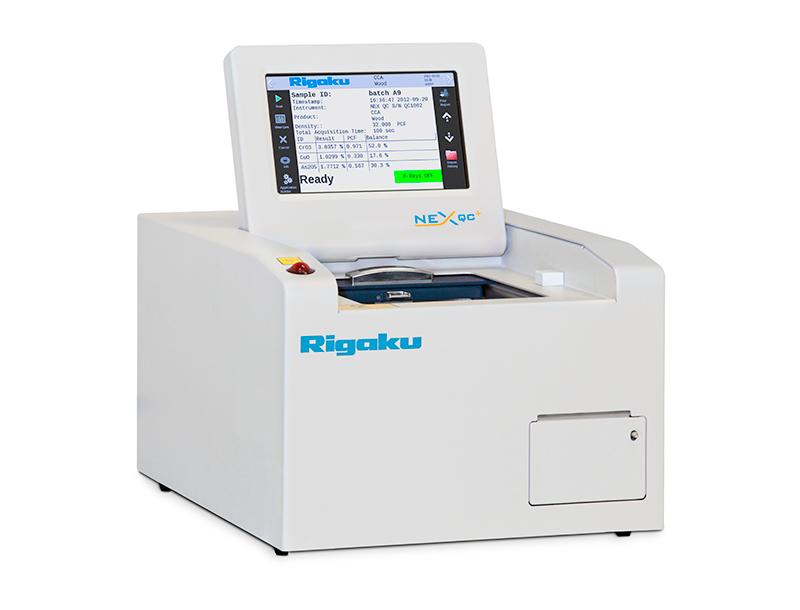 Model: NEX QC+
Calibration
Empirical calibrations were built using a suite of 23 commercially available calibration standards. The suite of calibration standards must be representative of the lube oil formulation to be analyzed. Use of empirical calibration ensures the particular lube oil formulation is exactly characterized and modeled, which yields optimum accuracy. Elements in the lube oil should vary evenly over each concentration range of interest, and the elements in the oil should vary independently of each other. Alpha corrections are then employed to automatically compensate for variations in X-ray absorption/enhancement effects within the sample due to the independent variations in element concentration. A summary of the empirical calibrations is shown here.
| Element | Concentration range | Standard error of estimate |
| P | 0.002 – 0.250 % | 0.006 |
| S | 0.050 – 2.500 % | 0.032 |
| Ca | 0.001 – 0.500 % | 0.0005 |
| Zn | 0.001 – 0.250 % | 0.0012 |
Repeatability
Representative samples from the calibration suite were chosen to demonstrate typical instrument repeatability (precision). Ten repeat analyses were performed with the sample in static position.
| Sample: 7 Units: % |
||||
| Element | Standard value | Average value | Std. dev | % Relative dev |
| P | 0.100 | 0.1007 | 0.0007 | 0.7 % |
| S | 1.251 | 1.272 | 0.007 | 0.6 % |
| Ca | 0.350 | 0.3578 | 0.0015 | 0.4 % |
| Zn | 0.001 | 0.0011 | 0.0001 | 10 % |
| Sample: 9 Units: % |
||||
| Element | Standard value | Average value | Std. dev | % Relative dev |
| P | 0 | --- | --- | --- |
| S | 0.750 | 0.7479 | 0.0034 | 0.5 % |
| Ca | 0.300 | 0.3055 | 0.0017 | 0.6 % |
| Zn | 0 | --- | --- | --- |
| Sample: 21 Units: % | ||||
| Element | Standard value | Average value | Std. dev | % Relative dev |
| P | 0.250 | 0.2492 | 0.0041 | 1.6 % |
| S | 2.500 | 2.514 | 0.014 | 0.6 % |
| Ca | 0.010 | 0.0120 | 0.0002 | 2.0 % |
| Zn | 0.050 | 0.0487 | 0.0002 | 0.4 % |
| Sample: 6 Units: % |
||||
| Element | Standard value | Average value | Std. dev | % Relative dev |
| P | 0.010 | 0.0110 | 0.0003 | 3.0 % |
| S | 0.250 | 0.246 | 0.001 | 0.4 % |
| Ca | 0.001 | 0.0019 | 0.0001 | 10 % |
| Zn | 0.225 | 0.2198 | 0.0006 | 0.3 % |
Conclusion
The NEX QC+ offers analysts and technicians a simple yet powerful and versatile system for quantifying elemental composition using the empirical approach. The results of this study indicate that given stable samples, proper sample handling and proper calibration technique, the Rigaku NEX QC+ EDXRF can achieve excellent results in monitoring the elemental concentration of lubricating oils.

Contact Us
Whether you're interested in getting a quote, want a demo, need technical support, or simply have a question, we're here to help.