Analysis of PVC Resins
Scope
This Application Note shows performance for the elemental analysis of Cl, Mg, Si, S, Ca, Ti, Mo and Sn in PVC resin. Empirical calibrations are shown for the quantitative analysis of the elements PVC resins, and instrument repeatability is demonstrated. Qualitative spectra are also shown, indicating the other trace elements in the resins (Cu, Zn, Cr, Sb, Fe, and Ni).
Background
 Polyvinyl chloride (PVC) is a very versatile thermoplastic polymer. The plastic is inexpensive and durable with excellent resistance to corrosion and chemical attack. PVC resins in fine powder granular form are produced and blended to make a myriad of products. Common uses of PVC include piping and hoses, bottles and bottle caps, and insulation coatings for wire. PVC is also used in flooring material, upholstery and clothing.
In the compounding process various PVC formulations are created. Pigments, stabilizers and stearates are added to adjust color and other physical properties of the final product. Plasticizers are also added to affect the flexibility and softness of the product, making PVC the third most common plastic used in industry.
In the research of PVC formulations as well as throughout the manufacturing process, a fast, reliable and precise method of analysis is required in the industry. The Rigaku EDXRF analyzer meets these needs with instrumentation advanced and versatile enough for expert use in R&D while remaining simple enough for use by non-technical operators in several areas of manufacturing QA/QC.
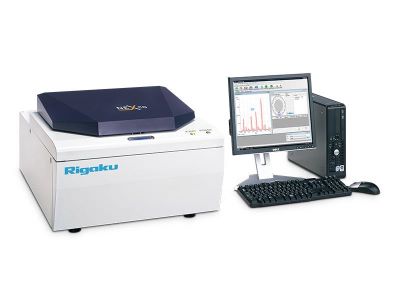 Model: NEX CG
Calibration
Calibrations were built using a suite of assayed calibration standards in puck form. The suite of calibration standards should be representative of the PVC formulation to be analyzed. The correlation for each calibration is shown here.
| Element: Sn Units: % Sn |
||
| Sample I.D. | Standard value | Calculated value |
| STD 1 | 0.0291 | 0.0291 |
| STD 2 | 0.0363 | 0.0352 |
| STD 3 | 0.0472 | 0.0494 |
| STD 4 | 0.0607 | 0.0597 |
| STD 5 | 0.0844 | 0.0842 |
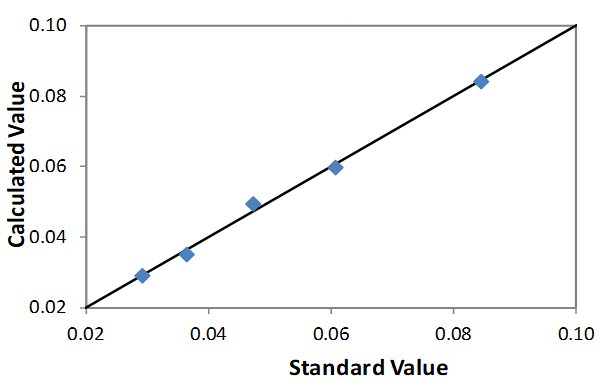 Correlation Plot Sn
| Element: Cl Units: % Cl |
||
| Sample I.D. | Standard value | Calculated value |
| STD 1 | 51.08 | 51.33 |
| STD 2 | 42.46 | 42.38 |
| STD 3 | 41.38 | 41.69 |
| STD 4 | 42.62 | 42.57 |
| STD 5 | 49.35 | 48.93 |
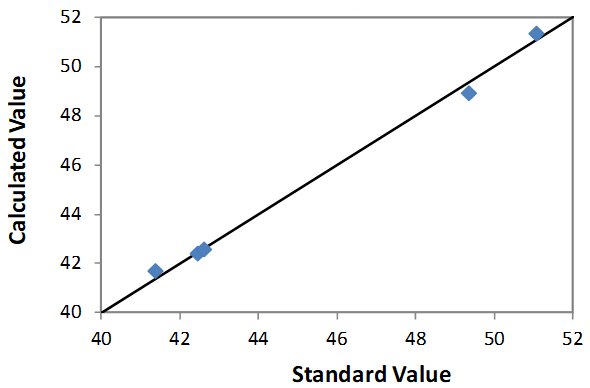 Correlation Plot Cl
| Element: Ca Units: % Ca |
||
| Sample I.D. | Standard value | Calculated value |
| STD 1 | 0.418 | 0.405 |
| STD 2 | 4.523 | 4.526 |
| STD 3 | 2.955 | 2.938 |
| STD 4 | 1.546 | 1.569 |
| STD 5 | n/a | n/a |
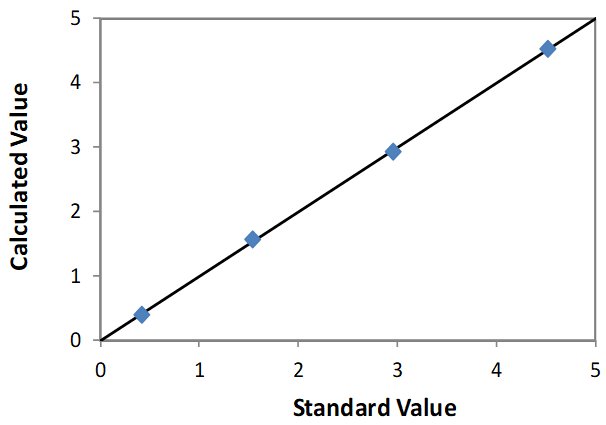 Correlation Plot Ca
| Element: Mo Units: % Mo |
||
| Sample I.D. | Standard value | Calculated value |
| STD 1 | 0.548 | 0.507 |
| STD 2 | 0.911 | 0.999 |
| STD 3 | 1.331 | 1.297 |
| STD 4 | 1.828 | 1.802 |
| STD 5 | 2.646 | 2.655 |
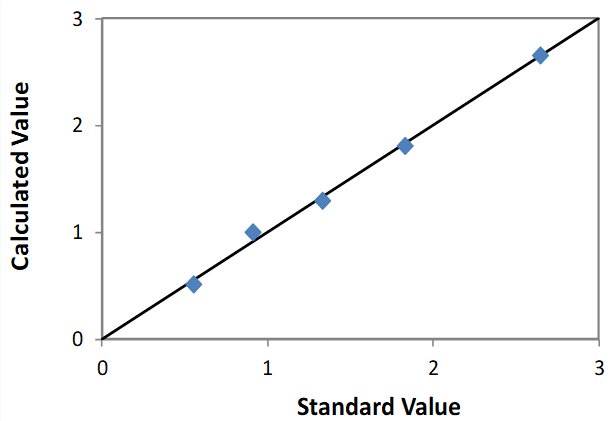 Correlation Plot Mo
| Element: Mg Units: % Mg |
||
| Sample I.D. | Standard value | Calculated value |
| STD 1 | 0.862 | 0.871 |
| STD 2 | 0.573 | 0.505 |
| STD 3 | 0.419 | 0.429 |
| STD 4 | 0.288 | 0.342 |
| STD 5 | 0.167 | 0.181 |
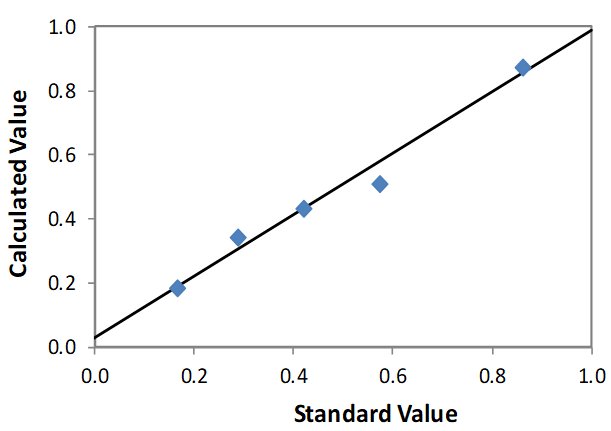 Correlation Plot Mg
| Element: Si Units: % Si |
||
| Sample I.D. | Standard value | Calculated value |
| STD 1 | 1.327 | 1.313 |
| STD 2 | 0.970 | 1.037 |
| STD 3 | 0.815 | 0.773 |
| STD 4 | 0.705 | 0.641 |
| STD 5 | 0.267 | 0.333 |
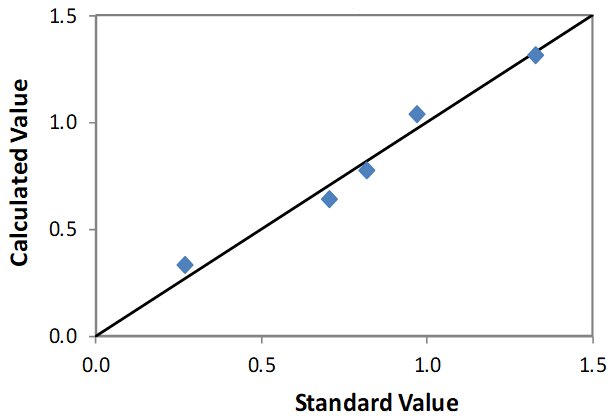 Correlation Plot Si
| Element: Ti Units: % Ti |
||
| Sample I.D. | Standard value | Calculated value |
| STD 1 | n/a | n/a |
| STD 2 | 2.08 | 2.13 |
| STD 3 | 4.05 | 3.84 |
| STD 4 | 6.25 | 6.25 |
| STD 5 | 0.241 | 0.213 |
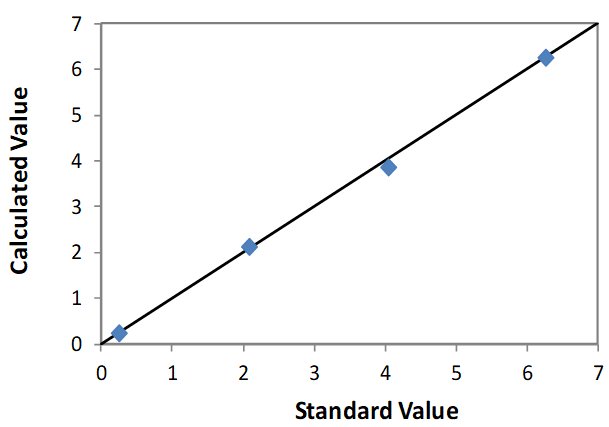 Correlation Plot Ti
Repeatability
To show instrument repeatability, short term precision was performed using STD 1 and STD 5. Ten repeat analyses of each sample were performed with the sample in static position.
| Element: Sn Units: Mass % |
||||
| Sample ID | Standard value | Average value* | Std dev | % Relative |
| STD 1 | 0.0291 | 0.0276 | 0.0021 | 7.7 |
| STD 5 | 0.0844 | 0.0841 | 0.0038 | 4.5 |
| Element: Cl Units: Mass % |
||||
| Sample ID | Standard value | Average value* | Std dev | % Relative |
| STD 1 | 51.08 | 51.98 | 0.12 | 0.2 |
| STD 5 | 49.35 | 48.85 | 0.10 | 0.2 |
| Element: Ca Units: Mass % |
||||
| Sample ID | Standard value | Average value* | Std dev | % Relative |
| STD 1 | 0.418 | 0.391 | 0.0101 | 2.7 |
| Element: Mo Units: Mass % |
||||
| Sample ID | Standard value | Average value* | Std dev | % Relative |
| STD 1 | 0.548 | 0.464 | 0.020 | 4.4 |
| STD 5 | 2.646 | 2.584 | 0.076 | 2.9 |
| Element: Mg Units: Mass % |
||||
| Sample ID | Standard value | Average value* | Std dev | % Relative |
| STD 1 | 0.862 | 0.803 | 0.014 | 1.8 |
| STD 5 | 0.167 | 0.210 | 0.010 | 4.7 |
| Element: Si Units: Mass % |
||||
| Sample ID | Standard value | Average value* | Std dev | % Relative |
| STD 1 | 1.327 | 1.236 | 0.018 | 1.4 |
| STD 5 | 0.267 | 0.342 | 0.022 | 6.4 |
| Element: Ti Units: Mass % |
||||
| Sample ID | Standard value | Average value* | Std dev | % Relative |
| STD 5 | 0.241 | 0.214 | 0.002 | 0.7 |
*Average value reflects the calculated value from the calibrations
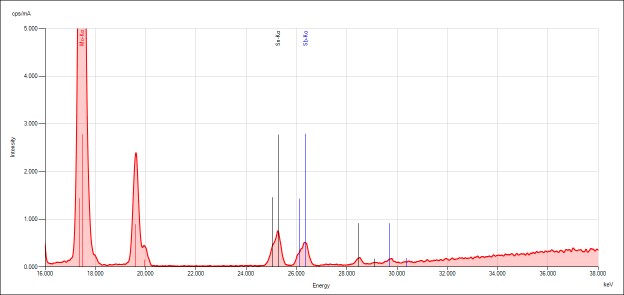
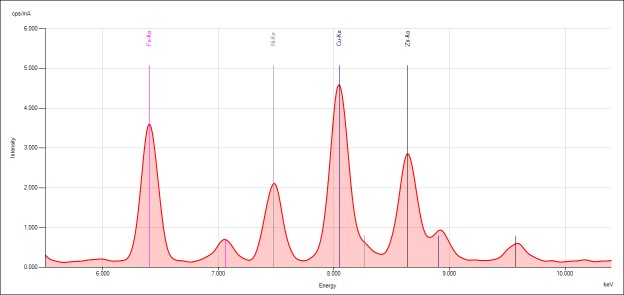
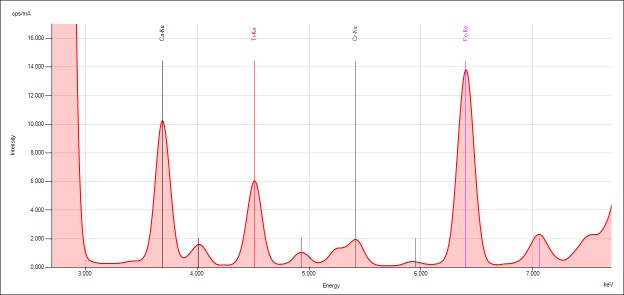
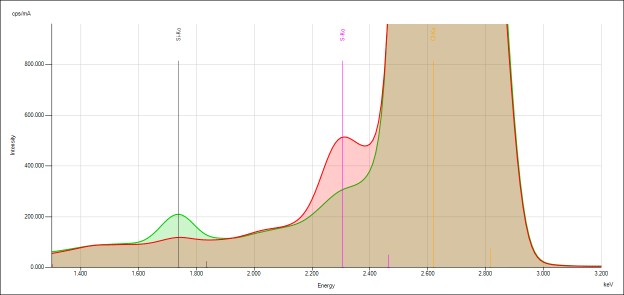
Qualtitative analysis
The spectra generated for STD 1 are shown. Relevant peaks are labeled accordingly and presented below.
Discussion
This App Note demonstrates the NEX CG’s capability to perform empirical quantitative analyses on an elemental series commonly found in PVC resins. PVC resins can be measured in powder form or as hot-pressed disks (pucks).
Empirical calibrations were built using a suite of assayed calibration standards. A suite of calibration standards should be representative of the matrix and element series to be measured in unknown samples. Each element should vary evenly across the entire expected concentration range and all elements should vary independently of each other. In this way, “alpha” corrections can be enabled to compensate for variations in X-ray absorption and enhancement matrix effects.
The samples used here contained S and Mo in a fixed concentration ratio. When the matrix composition contains S and Mo that vary independently among the samples, an overlap correction is employed to compensate for the spectral overlap between the S K-lines and the Mo L-lines.
In making hot-pressed disks the pucks can show surface anomalies, for example small indentations and scratches. Such surface anomalies can causes variations in X-ray scatter during repeatability testing and when samples are repositioned. To compensate for variations in X-ray results due to surface anomalies, use of the sample spinner is recommended.
Conclusion
The Rigaku NEX CG combines indirect excitation with secondary targets, polarization targets and a high performance SDD detector to yield the optimum performance in EDXRF instrumentation. The results shown here indicate the NEX CG is an excellent tool for R&D investigating resin formulations, as well as for use in the QA/QC of PVC manufacturing.

Contact Us
Whether you're interested in getting a quote, want a demo, need technical support, or simply have a question, we're here to help.