Submicron CT for the Life Sciences: Animal and Tissue Research Applications
Introduction
X-ray submicron computed tomography (submicron CT) is one of the most powerful methods for 3D visualization and inspection of any type of sample or product.
This non-destructive method provides sufficient resolution and contrast to evaluate any microstructural features, with the ability to resolve structures even below one micron. Moreover, this method requires minimal/no sample preparation, eliminating complicated tasks such as embedding, coating, or thin slicing required with other high-resolution methods. The Rigaku nano3DX represents state-of-the-art laboratory-based nanoscale X-ray imaging. This device, when used with deep learning methods, is an unmatched tool for animal and tissue science.
Instrument
The nano3DX is a true X-ray microscope (XRM) with the ability to measure relatively large samples at very high resolution. This is accomplished by using a high-powered rotating anode X-ray source and high-resolution sCMOS X-ray camera. The rotating anode provides for fast data acquisition and the ability to switch anode materials easily to optimize the data acquisition.
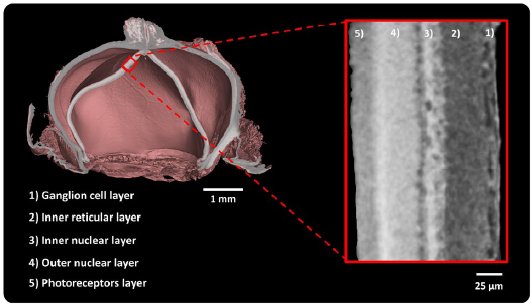
Figure 1: nano3DX allows imaging of whole anatomical structures (organs or animals) to individual tissue’s elements and cells. Rat eye analysis – courtesy of Simon Topp Christensen, M.Sc., Ph.D. (Rigshospitalet, Glostrup).
CT data and results
The introduction of high-resolution CT systems such as Rigaku’s nano3DX extends capabilities to image animal tissues and biomaterials in three (3D) and four (4D) dimensions at micron and sub-micron spatial resolutions, opening the way for virtual histology, live-cell imaging, subcellular imaging, and correlative microscopy. The imaging capabilities of Rigaku’s nano3DX CT provide a unique view of cells, as the instrument bridges the gap between the capabilities of light and electron microscopy imaging techniques. Moreover, nano3DX imaging overcomes limitations of light and electron microscopy workflows, which are limited by optical transparency of samples, technically demanding sample preparation (e.g., freezing or fixing and embedding in resin followed by serial sectioning), and a limited field of view (as in transmission electron microscopy).
Using Rigaku’s nano3DX, complete information about any animal or biomaterial sample, from macroscale to nanoscale, can be easily acquired in a non-destructive manner, thus enabling the visualization and the quantification of cellular features and intracellular spaces on a daily basis.
nano3DX provides insight into key factors, such as:
- Anatomic studies
- Development studies
- Phenotype evaluation
- Structural morphology
- Vascularization analysis
- Tissues and cellular-features analysis
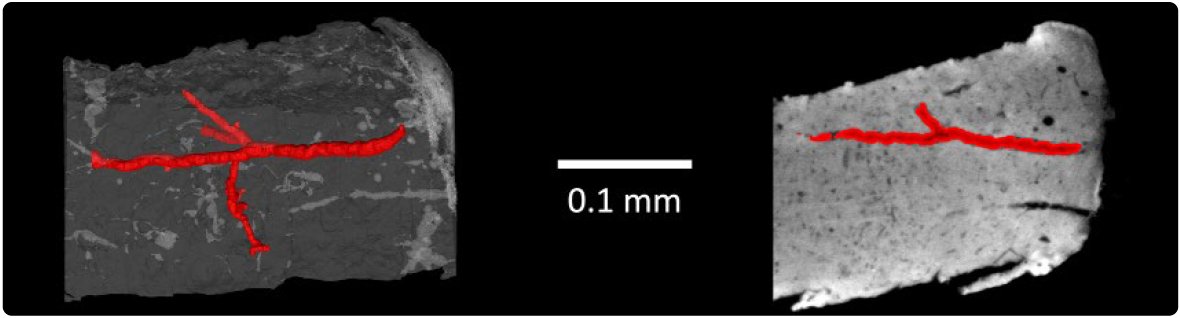
Figure 2: Vascularization analysis in the mouse cortex. Quantitative analysis of the main vessel: volume 230,000 μm3, length 475 μm, and average thickness 21.6 μm.
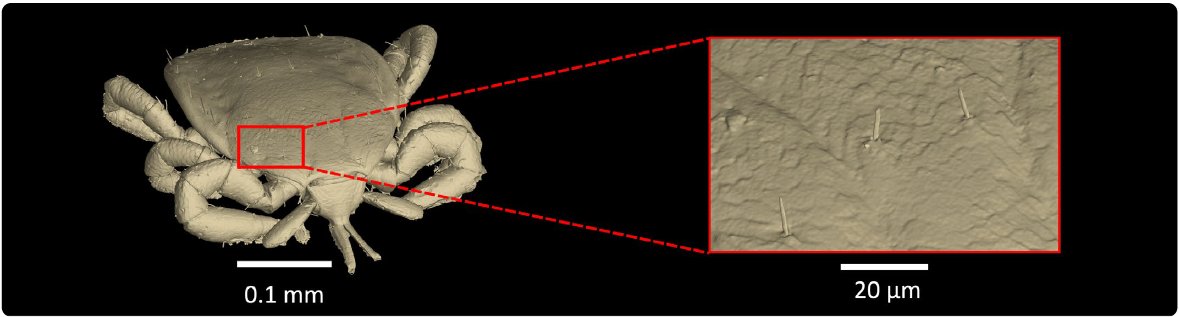
Figure 3: Morphological analysis of the tick larva (Ixodes ricinus). Sufficient spatial resolution enabled visualization of individual scales forming the dorsal shield together with the fine hair (Ø 5 µm). The life cycle of the castor bean tick consists of three stag-es – larva, nymph, and adult. The CT data shows that the tick larva is small (0.8 mm) compared to adults and has only three legs (the nymph and the adult have four pairs).
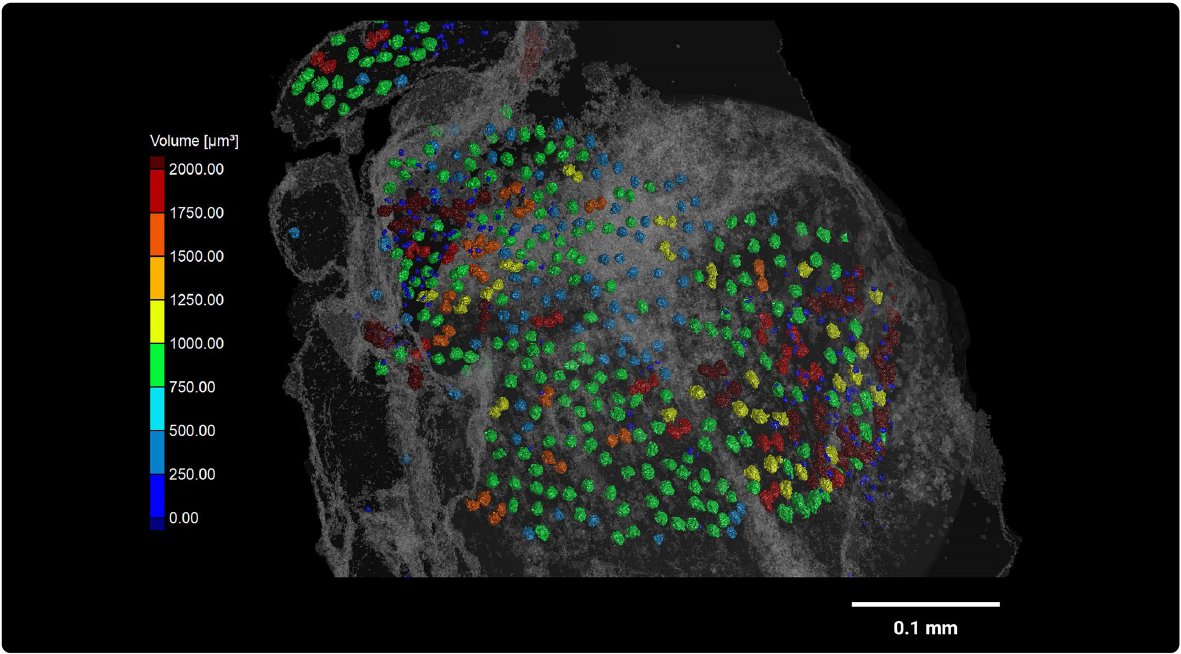
Figure 4: Volume analysis of Purkinje cell nuclei. Purkinje cells are found in the Purkinje layer in the mouse cerebellum. These cells are one of the largest neurons in the brain.
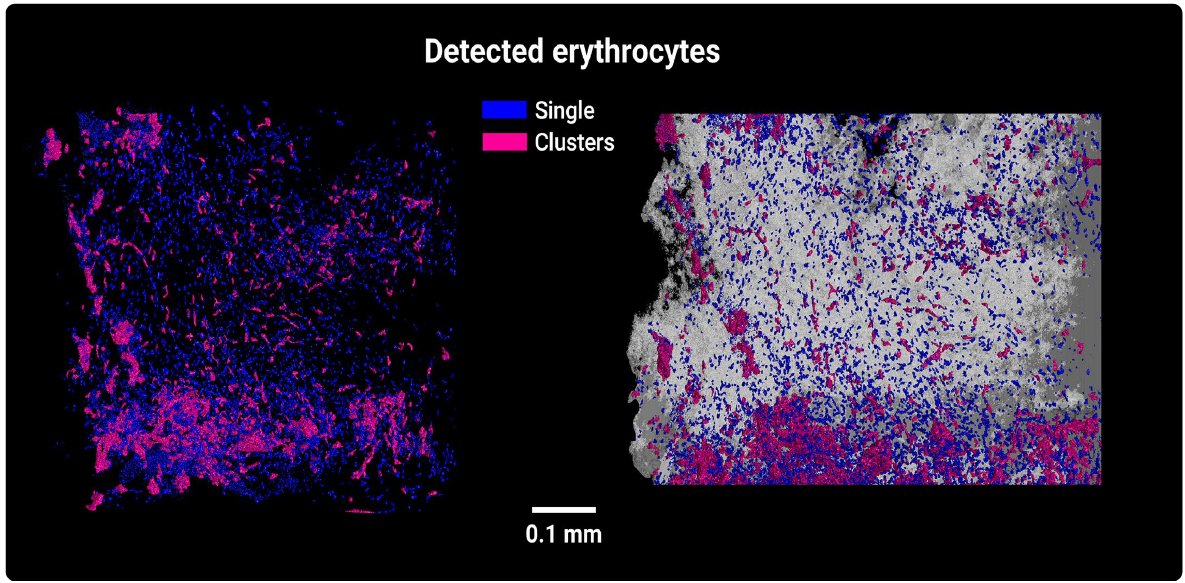
Figure 5: Mouse heart analysis. Visualization of erythrocytes in the septum. According to the results, the erythrocytes are pre-dominantly forming clusters.
CT analysis performed by CEITEC – CT Lab
Contact Us
Whether you're interested in getting a quote, want a demo, need technical support, or simply have a question, we're here to help.