Automatic Quant Application Setup Applied to Calibrating Coal Fly Ash Fused Beads
Introduction
Coal-fired power plants still account for a large proportion in the total power generation while the “low-carbon society” is the apparent trend all over the world. When coal is burned in the boiler of power plant, the ash called “coal fly ash” is absolutely generated in it and mostly recycled in the cement industry. In using the fly ash as a raw material of cement, it is very important to analyze the components accurately to ensure the quality of the products.
X-ray fluorescence spectrometry is already used widely in the cement industry as the powerful tool for controlling the quality of both raw materials and products and provided as an analysis standard in many countries. XRF is suitable for requirement of routine analysis because of its simplicity of sample preparation, high precision and rapidity of analysis. There are mainly two sample preparation methods in XRF analysis for the cement industry, one is a pressed powder method (briquette method) and the other is a fusion bead method. In selecting a sample preparation method, the inhomogeneity of the sample should be fully considered, because the inhomogeneity of the sample makes the analysis results worse. Since the sample is fused into a flux homogeneously, the powder sample of raw material such as coal fly ash is recommended to be prepared through the fusion bead method.
On the basis of Rigaku’s experiences and knowledges in WDXRF analysis technique developing for a long time, Rigaku has produced a new function “Automatic Quant Application Setup” and released for ZSX Primus IV and ZSX Primus IVi systems. This application note will demonstrate the “Automatic Quant Application Setup” function in the quantitative analysis for coal fly ash by fusion bead method.
Instrument
Both ZSX Primus IV and ZSX Primus IVi are sequential wavelength dispersive X-ray fluorescence (WDXRF) spectrometers, the former has the tube-above optics and the latter has that of tube-below. However there is basically no difference between these two types of optics in the fusion bead method, the former is recommended if not only fused beads but also pressed pellets are measured, because the former optics has structural advantage which is resistant to sample fall. The WDXRF system has advantages in spectral resolution and light element sensitivity. Since coal fly ash is mainly composed of SiO2, Al2O3 and other oxides of light elements, high spectral resolution and high sensitivities of light elements are essentially required to the analysis.
ZSX Primus IV and ZSX Primus IVi are equipped with a highly reliable 4 kW Rh-target end-window type X-ray tube consisting of an ultra-thin Be window that brings high sensitivity in all ranges of measurable elements. The system software “ZSX Guidance” is designed for ease of use in routine analyses. The “Flowbar” in quantitative analysis guides users through the calibration procedure. The “Sample ID Table” and the “Program Operation” help operators carry out daily analysis.
One of the most advanced functions in the ZSX Guidance software is “Automatic Quant Application Setup” which makes it possible to determine the most appropriate measuring conditions automatically. Users do not need to optimize measuring conditions by themselves any more. For example, when the program detects any overlap to a measurement line by another line or a higher order line from other elements in the sample, it automatically changes the measurement line or optimizes measurement condition to reduce these influences.
Reference samples and sample preparation
The calibration curves were created using 15 certified reference materials of coal fly ash distributed by National Institute of Standard and Technology (NIST), Japan Society for Analytical Chemistry (JSAC), European Commission's Joint Research Centre (JRC, BCR® standards are also distributed by JRC), Geological Survey of Japan (GSJ), etc.
These powder samples were prepared for measurement by the fusion bead method. This method is as common as pressed powder method for powder samples and is especially efficient for eliminating the inhomogeneity effect, which is obvious in samples like coal fly ash.
The well-dried (2 hours at 105°C) samples and flux (Li₂B₄O₇) with agent for reducing melting point were mixed well with a dilution ratio of 1 to 10 and fused at 1050°C for 7 minutes.
Calibration and results
Calibrations were performed for 10 major components (SiO₂, Al₂O₃, CaO, Fe₂O₃, SO₃, Na₂O, MgO, TiO₂, K₂O and P₂O₅) and 11 minor components (Zn, Mn, Pb, Cr, Cu, As, Sb, V, Cd, Ni and Co).
The path atmosphere was vacuum and the tube power was 2.4 kW. Counting times for each element are tabulated in Tables 1 and 2.
The other measuring conditions, such as analyzing line, analyzing crystal, primary beam filter, peak position, background (BG) position and PHA condition, were automatically optimized and set by the “Automatic quant application setup” function of the ZSX Guidance software.
The matrix effect was corrected by using theoretical alpha coefficients, which were calculated using the Fundamental Parameter (FP) method. Overlaps of lines were also corrected in some components. These required corrections are also automatically set by the function. Some representative calibration curves of major components are shown as examples in Figure 1, and those of minor components in Figure 2.
Table 1: Measuring conditions for major components
| Component | SiO₂ | TiO₂ | Al₂O3 | Fe₂O₃ | CaO |
| Element line | Si-Kα | Ti-Kα | Al-Kα | Fe-Kα | Ca-Kα |
| Counting time peak (s) |
20 | 20 | 20 | 20 | 20 |
| BG (s) | - | - | - | - | - |
| Component | MgO | Na₂O | K₂O | P₂O₅ | SO₃ |
| Element line | Mg-Kα | Na-Kα | K -Kα | P -Kα | S -Kα |
| Counting time peak (s) |
20 | 40 | 20 | 20 | 20 |
| BG (s) | 20 | 40 | - | - | - |
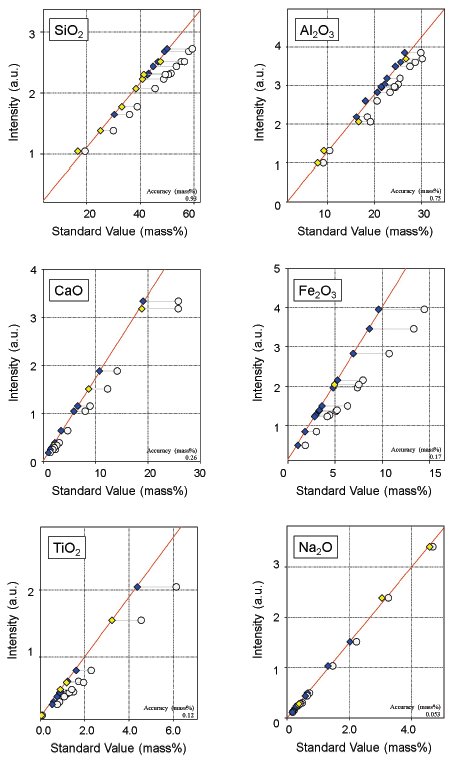
Figure 1: Examples of calibration curves for major components. White circles: before correction; Blue diamonds: after correction (certified value); Yellow diamonds: after correction (reference value)
Table 2: Measurement conditions for minor components
| Component | Cu | Zn | Ni | As | Pb | Cr |
| Element line | Cu-Kα | Zn-Kα | Ni-Kα | As-Kβ1 | Pb-Lβ1 | Cr-Kα |
| Counting time peak (s) |
40 | 40 | 40 | 40 | 40 | 40 |
| BG (s) | 40 | 40 | 40 | 40 | 40 | 40 |
| Component | V | Co | Cd | Mn | Sb | |
| Element line | V -Kα | Co-Kα | Cd-Kα | Mn-Kα | Sb-Kα | |
| Counting time peak (s) |
40 | 40 | 40 | 40 | 40 | |
| BG (s) | 40 | 40 | 40 | 40 | 40 |
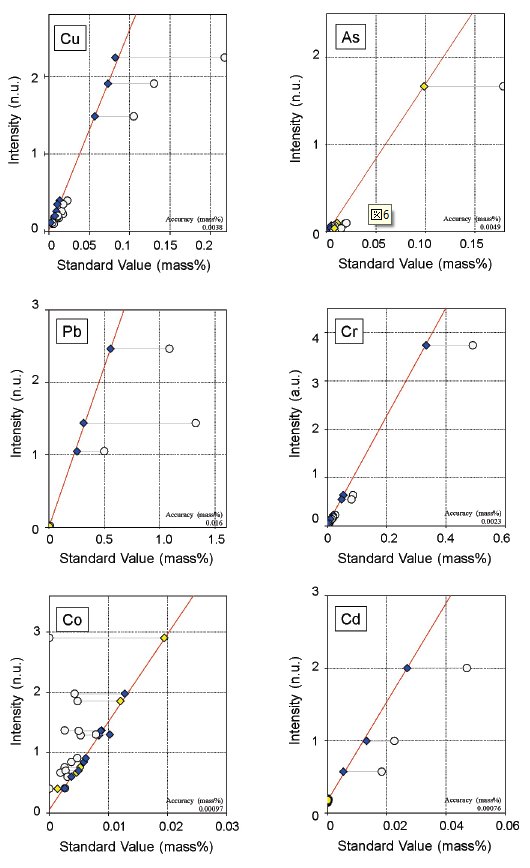
Figure 2: Examples of calibration curves for minor components. Overlap correction is applied to Co with Fe. White circles: before correction; Blue diamonds: after correction (certified value); Yellow diamonds: after correction (reference value)
Table 3: LLDs of minor components
| Component | Cu | Zn | Ni | As | Pb | Cr |
| LLD (mass%) | 0.0004 | 0.0006 | 0.0004 | 0.0009 | 0.0004 | 0.0008 |
| Component | V | Co | Cd | Mn | Sb | |
| LLD (mass%) | 0.0010 | 0.0005 | 0.0008 | 0.0007 | 0.0040 |
Lower limit of detection (LLD) for minor components, which are tabulated in Table 3, were obtained as follows:
$LLD = 3 \cdot \frac{1}{m} \cdot \sigma_B = 3 \cdot \frac{1}{m} \cdot \sqrt{\frac{I_B}{1000 \cdot t}}$
$m$ : sensitivity of calibration (kcps/mass%)
$\sigma_B$ : standard deviation of blank intensity (kcps)
$I_B$ : blank intensity (kcps)
$t$ : counting time (s)
To test precision, a fused bead of certified reference material IR ECH 12-1-03 was measured 10 times and the result is shown in Table 4.
Table 4: Result of the 10-time repeat measurement (IR ECH 12-1-03).
| SiO₂ | TiO₂ | Al₂O₃ | Fe₂O₃ | CaO | MgO | Na₂O | K₂O | P₂O₅ | SO₃ | |
| mass% | mass% | mass% | mass% | mass% | mass% | mass% | mass% | mass% | mass% | |
| Certified value |
53.5 | 2.29 | 27.6 | 7.96 | 2.6 | 1.31 * | 0.39 * | 1.59 | - | - |
| N=1 | 53.964 | 2.287 | 28.269 | 7.977 | 2.568 | 1.286 | 0.400 | 1.671 | 0.238 | 0.346 |
| 2 | 53.892 | 2.277 | 28.211 | 7.962 | 2.561 | 1.279 | 0.388 | 1.661 | 0.234 | 0.347 |
| 3 | 53.894 | 2.280 | 28.184 | 7.958 | 2.562 | 1.289 | 0.400 | 1.663 | 0.236 | 0.349 |
| 4 | 53.844 | 2.291 | 28.183 | 7.968 | 2.567 | 1.296 | 0.384 | 1.655 | 0.237 | 0.346 |
| 5 | 53.931 | 2.275 | 28.217 | 7.966 | 2.555 | 1.305 | 0.397 | 1.656 | 0.237 | 0.348 |
| 6 | 53.896 | 2.291 | 28.232 | 7.971 | 2.566 | 1.290 | 0.393 | 1.661 | 0.239 | 0.345 |
| 7 | 53.881 | 2.275 | 28.215 | 7.959 | 2.568 | 1.302 | 0.385 | 1.667 | 0.238 | 0.344 |
| 8 | 53.883 | 2.287 | 28.222 | 7.967 | 2.570 | 1.299 | 0.389 | 1.655 | 0.236 | 0.348 |
| 9 | 53.837 | 2.283 | 28.193 | 7.967 | 2.560 | 1.305 | 0.399 | 1.661 | 0.239 | 0.345 |
| 10 | 53.884 | 2.281 | 28.170 | 7.969 | 2.572 | 1.297 | 0.385 | 1.659 | 0.235 | 0.344 |
| Average | 53.890 | 2.283 | 28.210 | 7.966 | 2.565 | 1.295 | 0.392 | 1.661 | 0.237 | 0.346 |
| Std dev. | 0.0370 | 0.0063 | 0.0289 | 0.0055 | 0.0053 | 0.0086 | 0.0065 | 0.0053 | 0.0017 | 0.0018 |
| RSD(%) | 0.07 | 0.27 | 0.10 | 0.07 | 0.21 | 0.67 | 1.67 | 0.32 | 0.70 | 0.53 |
| Cu | Zn | Ni | As | Pb | Cr | V | Co | Mn | Cd | Sb | |
| mass% | mass% | mass% | mass% | mass% | mass% | mass% | mass% | mass% | mass% | mass% | |
| Certified value |
0.0157 | 0.0251* | 0.0117* | 0.00569 | 0.00707 | 0.0183 | 0.0373 | 0.00498 | 0.0381 | 0.00031 | 0.00037 |
| N=1 | 0.0158 | 0.0254 | 0.0129 | 0.0053 | 0.0062 | 0.0189 | 0.0387 | 0.0056 | 0.0351 | N.D. | N.D. |
| 2 | 0.0159 | 0.0256 | 0.0126 | 0.0047 | 0.0056 | 0.0191 | 0.0390 | 0.0056 | 0.0349 | N.D. | N.D. |
| 3 | 0.0156 | 0.0256 | 0.0124 | 0.0053 | 0.0060 | 0.0187 | 0.0382 | 0.0054 | 0.0347 | N.D. | N.D. |
| 4 | 0.0158 | 0.0252 | 0.0128 | 0.0053 | 0.0065 | 0.0194 | 0.0383 | 0.0059 | 0.0349 | N.D. | N.D. |
| 5 | 0.0160 | 0.0257 | 0.0126 | 0.0055 | 0.0062 | 0.0196 | 0.0379 | 0.0057 | 0.0351 | N.D. | N.D. |
| 6 | 0.0157 | 0.0257 | 0.0126 | 0.0053 | 0.0057 | 0.0197 | 0.0389 | 0.0055 | 0.0350 | N.D. | N.D. |
| 7 | 0.0161 | 0.0256 | 0.0127 | 0.0054 | 0.0061 | 0.0195 | 0.0385 | 0.0053 | 0.0346 | N.D. | N.D. |
| 8 | 0.0158 | 0.0252 | 0.0128 | 0.0055 | 0.0061 | 0.0190 | 0.0381 | 0.0057 | 0.0346 | N.D. | N.D. |
| 9 | 0.0158 | 0.0260 | 0.0129 | 0.0056 | 0.0059 | 0.0196 | 0.0383 | 0.0053 | 0.0350 | N.D. | N.D. |
| 10 | 0.0158 | 0.0254 | 0.0126 | 0.0059 | 0.0065 | 0.0182 | 0.0393 | 0.0054 | 0.0349 | N.D. | N.D. |
| Average | 0.0158 | 0.0255 | 0.0127 | 0.0054 | 0.0061 | 0.0192 | 0.0385 | 0.0055 | 0.0349 | - | - |
| Std dev. | 0.0001 | 0.0002 | 0.0002 | 0.0003 | 0.0003 | 0.0005 | 0.0004 | 0.0002 | 0.0002 | - | - |
| RSD(%) | 0.85 | 0.88 | 1.25 | 5.72 | 5.10 | 2.50 | 1.16 | 3.74 | 0.52 | - | - |
Conclusions
Analysis of coal fly ash was carried out by the fusion bead method using Rigaku high-performance WDXRF spectrometer ZSX Primus IV and ZSX Primus IVi. Calibration curves of both major and minor components show good linearity. LLDs of minor components are all less than 1/100 mass%, demonstrating good performance to control minor component concentrations including hazardous elements. The results of repeat measurements show good precision and reveal the system is suitable for quality control of recycled cement raw material such as coal fly ash.
Rigaku ZSX Primus IV and ZSX Primus IVi sequential wavelength dispersive X-ray fluorescence spectrometers are developed as multi-purpose systems for R&D, QC, etc. based upon advanced technology that has been developed with the customer’s confidence for a long time in various fields. The newly developed operation software “ZSX Guidance” provides strong support for operators in establishing measuring conditions and calibrating the system, and operators can perform analysis without professional expertise. The improvement of processing in counting circuit and optimization of the sample changer and various driving system promotes greater efficiency of analysis.

Contact Us
Whether you're interested in getting a quote, want a demo, need technical support, or simply have a question, we're here to help.