Trace Element Analysis in Geological Samples by the Pressed Powder Method, using GEO-TRACE-PAK
Introduction
Trace elements in geological materials, such as rock, sediment, mineral and ore, are important from the stand-point of natural resource and the environment. To establish calibration for trace elements in such a broad range of geological materials, it is necessary to collect many reference materials covering a wide variety of compositions. Furthermore, it is not easy to determine the optimum conditions for trace element analysis of complex matrices of geological materials by the pressed powder method, which is applied because of low concentrations of trace elements.
Rigaku provides an analysis package for trace element analysis of geological materials, named "GEO-TRACE- PAK".
This application note introduces GEO-TRACE-PAK and demonstrates analysis results of trace elements in geological samples using this analysis package.
Precalibration package "GEO-TRACE-PAK"
"GEO-TRACE-PAK" is a "pre-"calibration package that provides a quantitative application set including calibration, measuring conditions and analysis parameters. Since the pre-calibration package is pre-installed at our factory, analysis work can start soon after system installation is completed.
"GEO-TRACE-PAK" was developed from over one hundred certified reference materials (geological and ore samples) by the pressed powder method. Using this package, quantitative analysis of 26 trace elements can be carried out. The analysis results of 9 major components are used to correct for the trace element analysis. Two multi-element glass disks included in the package are used for maintenance of the calibration curves.
The contents of GEO-TRACE-PAK are as follows:
- Drift correction samples
- XRF monitor glass disks, 2 pcs.
- Validation samples
- Pressed powder disks with binder mixed, 2 pcs.(NIM-GBW07103, NIM-GBW07107)
- Binder for pressing
- SpectroBlend®, 1 bottle (~200 g)
- Backup CD
- calibration curves (calibration constants)
- correction coefficients
- measurement conditions
- other application setting
- Instruction manual
The contents of the backup CD are pre-installed on the system before it is shipped. Users do not have to install the package during system installation.
Instrument
GEO-TRACE-PAK is applicable to Rigaku's ZSX Primus IV, ZSX Primus IVi and ZSX Primus III NEXT sequential wavelength-dispersive (WD) XRF spectrometer. An optional analyzing crystal LiF(220) is required to add better spectral resolution to the WDXRF spectrometer. In the case of ZSX Primus III NEXT, the optional Ge crystal is also required.
Certified reference materials
A total of 101 certified reference materials (CRMs) were used to establish the GEO-TRACE-PAK calibration. The providers of the CRMs used are:
- Geological Survey of Japan
- U.S. Geological Survey
- Canada Centre for Mineral and Energy Technology
- Natural Resources of Canada
- MINTEK (South Africa)
- State Bureau of Technical Supervision, China
- National Research Council Canada
- National Institute of Standards and Technology (U.S.)
- National Research Centre of Geoanalysis (China)
- National Institute for Environmental Studies (Japan)
Calibration
Calibration curves for 26 trace elements, as well as 9 major components for reference, were established. The summary of the calibration is shown in Table 1. Theoretical alpha correction, overlap correction and Compton ratio correction were applied when required. Representative calibration curves (Cr, Y and Pb) are shown in Figure 1.
The accuracy of calibration was calculated by the following formula:
$Accuracy = \sqrt{ \frac{\sum_i{(C_i-\hat{C}_i)^2}}{n-m} }$
$C_i$: calculated value of standard sample
$\hat{C}_i$: reference value of standard sample
n : number of standard samples.
m: degree of freedom (linear 2, quad. 3)
The LLD (lower limit of detection) is calculated by the following formula:
$LLD = 3 \cdot \frac{1}{m} \cdot \sigma_B = 3 \cdot \frac{1}{m} \cdot \sqrt{\frac{I_B}{1000 \cdot t}}$
$m$ : sensitivity of calibration (kcps/mass%)
$\sigma_B$ : standard deviation of blank intensity (kcps)
$I_B$ : blank intensity (kcps)
$t$ : counting time (s)
Table 1: Calibration summary.
| Element | Concentration range (ppm) | Accuracy (ppm) | Correc.*2 |
| Sc | 3 - 78 | 4 | A, L |
| V | 3 - 768 | 14 | A, L |
| Cr | 3 - 24000 | 13 / 510 *1 | A, L |
| Co | 3 - 324 | 8 | A, L |
| Ni | 2 - 3780 | 5 / 67 *1 | C |
| Cu | 2 - 37300 | 11 / 470 *1 | C |
| Zn | 2 - 27500 | 12 / 350 *1 | C, L |
| Ga | 1 - 37 | 3 | C, L |
| As | 4 - 1540 | 6 / 49 *1 | C, L |
| Br | 1 - 217 | 3 | C |
| Rb | 1 - 800 | 7 | C, L |
| Sr | 1 - 12000 | 13 / 21 *1 | C, L |
| Y | 1 - 718 | 7 | C, L |
| Zr | 1 - 11000 | 20 / 50 *1 | C, L |
| Nb | 1 - 3900 | 3 / 200 *1 | C, L |
| Mo | 1 - 15100 | 2 / 23 *1 | C, L |
| Sn | 1 - 1723 | 8 | C |
| Ba | 7 - 2400 | 46 | A, L |
| La | 5 - 1340 | 5 / 7 *1 | A |
| Ce | 4 - 2230 | 25 / 130 | A, L |
| Nd | 4 - 670 | 4 / 47 *1 | A, L |
| W | 3 - 3600 | 35 | C, L |
| Pb | 2 - 41700 | 10 / 580 *1 | C, L |
| Bi | 2 - 680 | 36 | C, L |
| Th | 2 - 1103 | 8 | C, L |
| U | 2 - 650 | 3 | C, L |
| Major components (reference) | |||
| Component | Concentration range (mass%) | Accuracy (mass%) | Correc.*2 |
| CaO | - 55.1 | 0.9 / 2.7 *1 | A |
| TiO₂ | - 7.7 | 0.06 | A |
| Fe₂O₃ | - 55.6 | 1.6 | A |
| Mn | - 1.75 | 0.019 | A, L |
| K₂O | - 15.4 | 0.2 | |
| S | - 7.0 | 0.3 | |
| P₂O₅ | - 2.6 | 0.09 | |
| MgO | - 49.4 | 1.0 | A |
| Na₂O | - 10.7 | 0.3 | A |
*1 The calibration curve is split. The values on the left and right are accuracies for the lower and upper parts of the calibration respectively.
*2 The following corrections are applied: A: theoretical alpha correction; L: overlap correction; C: Compton ratio correction.
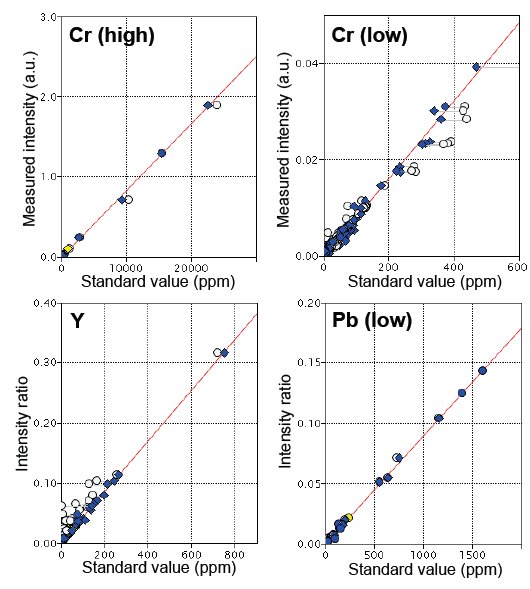
Figure 1: Representative calibration curve of Cr, Y and Pb. For Cr, the calibration curves for higher and lower ranges are shown. For Y and Pb, Compton scatter ratio correction is applied; the vertical axis of the calibration curve is the intensity ratio of the element line to Rh-Kα Compton scatter line.
Sample preparation
GEO-TRACE-PAK can be applied to pressed powder briquettes either with or without binder. The calibration was established with pressed powder disks of the CRMs without binder, but it includes correction coefficients for the mixing ratio of binder; therefore, the calibration is applicable to variable binder ratios. The binder content should be 20% or less of the total weight. The binder should be SpectroBlend®. Analysis samples should be ground to a grain size of 50 μm or less.
Evaluation analysis
Analysis for evaluation was performed using the ZSX Primus IV with a 4 kW Rh target X-ray tube. The CRMs, GSR-4 (sandstone) and SY-4 (diorite gneiss) were used for the evaluation analysis; one pressed disk was prepared without binder and another disk was prepared with SpectroBlend® 10% by weight, for each of the CRMs.
The analysis results were tabulated in Table 3.
Table 2: Typical lower limit of detection (LLD) (unit: ppm)
| Element | LLD | Element | LLD |
| Sc | 1.3 | Zr | 0.2 |
| V | 1.0 | Nb | 0.2 |
| Cr | 1.2 | Mo | 0.2 |
| Co | 0.7 | Sn | 0.9 |
| Ni | 0.8 | Ba | 4.2 |
| Cu | 0.7 | La | 3.8 |
| Zn | 0.6 | Ce | 5.3 |
| Ga | 0.5 | Nd | 2.6 |
| As | 1.2 | W | 1.1 |
| Br | 0.2 | Pb | 0.7 |
| Rb | 0.2 | Bi | 0.7 |
| Sr | 0.3 | Th | 0.5 |
| Y | 0.3 | U | 0.6 |
Table 3: Evaluation analysis results, using two CRMs, GSR-4 (sandstone) and SY-4 (diorite gneiss). (unit: ppm)
| Element | Sample: GSR-4 (sandstone) | Element | Sample: SY-4 (diorite gneiss) | ||||
| Standard value | XRF analysis results | Standard value | XRF analysis results | ||||
| Without binder | 10% binder added | Without binder | 10% binder added | ||||
| Sc | 4.2 | 5 | 6 | Sc | 1.1 | n.d. | n.d. |
| V | 33 | 39 | 38 | V | 8 | 14 | 14 |
| Cr | 20 | 26 | 21 | Cr | 12 | 15 | 13 |
| Co | 6.4 | 6 | 5 | Co | 2.8 | 4 | 4 |
| Ni | 16.6 | 16 | 15 | Ni | 9 | 6 | 6 |
| Cu | 19 | 15 | 16 | Cu | 7 | 3 | 4 |
| Zn | 20 | 20 | 18 | Zn | 93 | 90 | 88 |
| Ga | 5 | 5 | 4 | Ga | 35 | 33 | 30 |
| As | 9.1 | 8 | 9 | As | 1 | 1 | 2 |
| Br | - | n.d. | n.d. | Br | 217 | 221 | 216 |
| Rb | 29 | 31 | 31 | Rb | 55 | 59 | 58 |
| Sr | 58 | 60 | 61 | Sr | 1191 | 1171 | 1170 |
| Y | 21.5 | 22 | 21 | Y | 119 | 124 | 121 |
| Zr | 214 | 205 | 201 | Zr | 517 | 470 | 492 |
| Nb | 5.9 | 5 | 5 | Nb | 13 | 9 | 9 |
| Mo | 0.76 | n.d. | n.d. | Mo | 0.28 | n.d. | n.d. |
| Sn | 1.1 | 1 | n.d. | Sn | 7.1 | 10 | 8 |
| Ba | 143 | 142 | 145 | Ba | 340 | 353 | 354 |
| La | 21 | 22 | 24 | La | 58 | 62 | 57 |
| Ce | 48 | 48 | 50 | Ce | 122 | 127 | 121 |
| Nd | 21 | 20 | 20 | Nd | 57 | 60 | 61 |
| W | 1 | n.d. | n.d. | W | 3 | 10 | 8 |
| Pb | 7.6 | 7 | 8 | Pb | 10 | 10 | 10 |
| Bi | 0.18 | n.d. | n.d. | Bi | - | n.d. | n.d. |
| Th | 7 | 8 | 8 | Th | 1.4 | 1 | 1 |
| U | 2.1 | 4 | 4 | U | 0.8 | 1 | 1 |
Conclusions
Rigaku provides the "GEO-TRACE-PAK" precalibration package for trace element analysis in geological materials. The calibration and related parameters, such as measurement conditions and correction coefficients, are pre-installed on the system. Users can start the analysis by running the drift correction samples included in the package.
Since the calibration is established with overlap correction, Compton scatter ratio correction and theoretical alpha corrections by major elements, GEO-TRACE-PAK can be applied for various geological materials.
This package includes correction coefficients for the mixing ratio of the binder, SpectroBlend®. It is possible to choose whether to use the binder or not, or adjust the mixing ratio of the binder depending on the properties of the geological materials to be examined.

Contact Us
Whether you're interested in getting a quote, want a demo, need technical support, or simply have a question, we're here to help.