Silicate Rock Analysis by Fusion Method
Introduction
Geochemical data set for silicate rocks are essential for modern petrology. Concentrations of major and trace components in igneous rock sample provide many kinds of information about rock history such as eruption or solidification, magma evolution, magma genesis and source materials as well as petrographical classification.
X-ray fluorescence spectrometry for silicate rock analysis has been developed for the last few decades. XRF technique is currently used as standard analytical method to determine the chemical composition of major elements in silicate rocks.
Rock analysis which demands high accuracy requires the fusion method to eliminate sample heterogeneity, such as grain size and mineralogical effect, owing to various rock-forming minerals. Conventional fusion method has been dominantly used for determination of major elements in silicate rock because dilution by flux significantly reduces sensitivities of trace elements. Pressed powder method is, therefore, applied to trace element analysis. Since it is not efficient and time-consuming that one sample analysis requires two preparation methods, the low dilution fusion method was developed. The low dilution fusion bead technique is a method to improve sensitivity of trace elements, which enables to determine the concentrations of trace elements accurately and reliably as well as major element determination by XRF.
This note demonstrates advanced methods to determine the chemical composition in silicate rocks by XRF.
Instrument
The ZSX Primus II and Primus IV are floor-standing sequential wavelength dispersive X-ray fluorescence (WDXRF) spectrometer, which has advantages of high spectral resolution and high sensitivity for light elements. These instruments are designed to provide reliable analysis results and its flexibility provides multipurpose availability to a wide range of applications.
Both spectrometers are equipped with a high-performance 4 kW Rh target X-ray tube with ultra-thin beryllium window. The tube provides unconventional high sensitivity for light element analysis. Analyzing crystals cover from beryllium to uranium measurement. The instrument has a built-in intelligent auto sample changer (ASC).
The spectrometers have a unique optical configuration designed to minimize errors caused by uneven bead surface. It enables to measure fused beads with high precision in which the surface becomes curved by deformation of platinum crucible in continuous fusion operation.
Operation software provides non-specialist users with easy-to-use operation. In particular, flowbar system fully supports the user’s operation on the setting-up of quantitative analysis. In addition, ZSX Primus IV is equipped with newly developed function, “Automatic quant application setup” for less-experienced XRF users.
Sample and sample preparation
The standard samples used for calibration were 14 certified reference materials (CRMs) supplied from the Geological Survey of Japan (GSJ). These standards are composed of basic to acidic igneous rocks. Range of SiO2 content in these CRMs is wide from 43.6 to 76.8 in mass%.
The well-dried (2 hours at 105° C) samples were fused with mixed flux of Spectroflux 100B (4LiBO₂:1Li₂B₄O₇) supplied from Johnson Matthey with sample to flux ratio 1:2 by using a fusion machine.
Measurement
The spectrometer with 4kW Rh target X-ray tube was used for measurement. Each measurement was performed at the tube condition in full load. All of trace elements were measured with primary beam filter to reduce background. Counting times for the rare earth elements were 400 – 800 seconds and for the other trace elements, 100 – 200 seconds.
Matrix correction coefficients (alpha) in the calibration were theoretically calculated by built-in FP software. In the calculation of theoretical alpha, ignition loss was set as balance component.
Results
Calibration curves for major elements are shown in Figure 1. Accuracy of SiO2 is less than 0.2 in such a wide concentration range. The other calibration curves also show excellent accuracy.
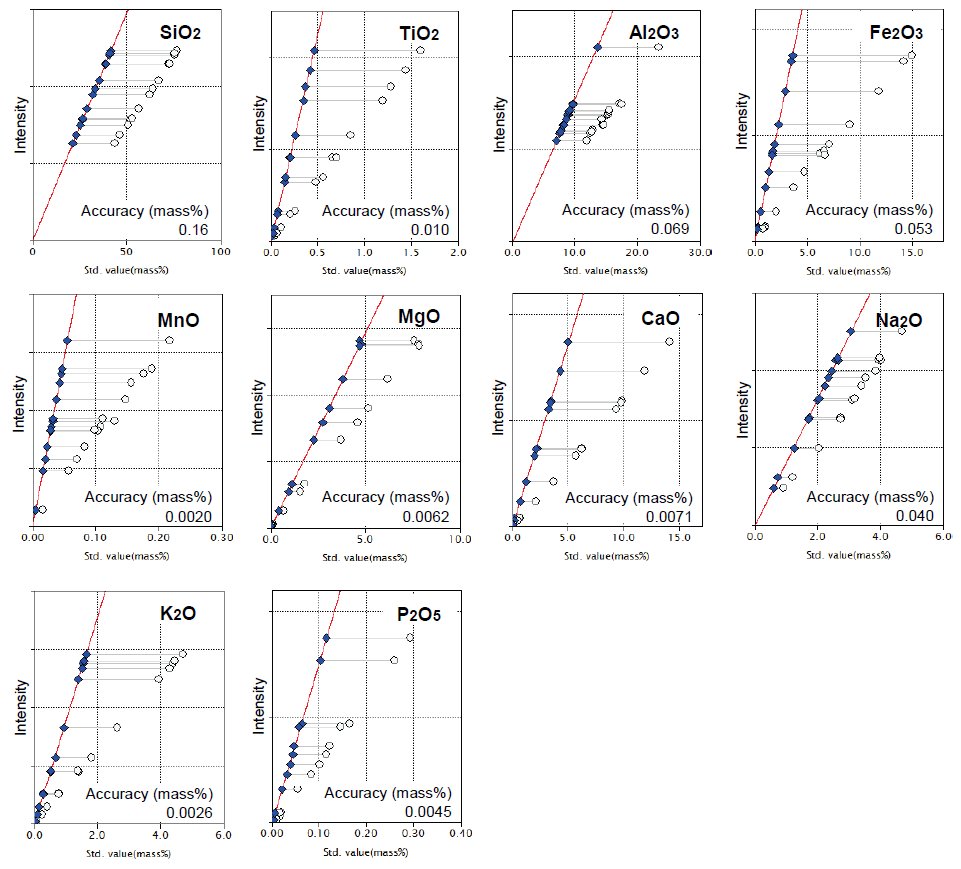
Figure 1: Calibration curves of major components Open circle: uncorrected point
Solid diamond: corrected point
The accuracy is calculated by the following formula:
$Accuracy = \sqrt{ \frac{\sum_i{(C_i-\hat{C}_i)^2}}{n-m} }$
$C_i$: calculated value of standard sample
$\hat{C}_i$: reference value of standard sample
n : number of standard samples.
m: degree of freedom (linear 2, quad. 3)
Typical lower limit of detection (LLD) and typical accuracy of calibration curve for each trace element are shown in Table 1. The LLDs are calculated as following:
$LLD = 3 \cdot \frac{1}{m} \cdot \sigma_B = 3 \cdot \frac{1}{m} \cdot \sqrt{\frac{I_B}{1000 \cdot t}}$
$m$ : sensitivity of calibration (kcps/mass%)
$s_B$ : standard deviation of blank intensity (kcps)
$I_B$ : intensity of the blank (kcps)
$t$ : counting time (s); 100 s is used
Table 1: Typical LLD and accuracy of calibration curve for trace elements (unit : ppm)
| Component / Element | Typical LLD (100s, 3σ) | Typical accuracy |
| Ba | 4.5 | 12.9 |
| Ce | 1.9 | 2.5 |
| Co | 0.2 | 1.3 |
| Cr | 0.5 | 2.5 |
| Cu | 0.2 | 5.9 |
| Ga | 0.2 | 0.6 |
| La | 1.9 | 2.4 |
| Nb | 0.5 | 1.1 |
| Nd | 4.2 | 2.5 |
| Ni | 0.2 | 3.3 |
| Pb | 0.1 | 0.5 |
| Rb | 0.1 | 3.5 |
| Sc | 0.5 | 3.7 |
| Sm | 2.5 | 1.3 |
| Sr | 0.1 | 4.6 |
| Th | 0.2 | 1.3 |
| V | 0.8 | 3.9 |
| Y | 0.1 | 0.6 |
| Yb | 1.3 | 0.7 |
| Zn | 0.1 | 1.7 |
| Zr | 0.1 | 6.0 |
The 4 kW high-power X-ray tube has great advantage in determination for trace elements.
To test instrumental precision, 20 time measurements were performed with a granodiorite sample (JG-3). The results of average and standard deviation of each component are shown in Table 2.
Table 2: Result of precision test (unit : ppm)
| Component / Element | Certified value | Average of 20 measurements | Std. dev. | RSD% |
| SiO₂ (mass%) |
67.29 | 67.05 | 0.037 | 0.054 |
| TiO₂ (mass%) |
0.48 | 0.48 | 0.002 | 0.34 |
| Al₂O₃ (mass%) |
15.48 | 15.50 | 0.012 | 0.074 |
| T.Fe₂O₃ (mass%) |
3.69 | 3.71 | 0.004 | 0.096 |
| MnO (mass%) |
0.071 | 0.071 | 0.0004 | 0.62 |
| MgO (mass%) |
1.79 | 1.80 | 0.007 | 0.40 |
| CaO (mass%) |
3.69 | 3.67 | 0.004 | 0.10 |
| Na₂O (mass%) |
3.96 | 4.02 | 0.018 | 0.44 |
| K₂O (mass%) |
2.64 | 2.61 | 0.002 | 0.086 |
| P₂O₅ (mass%) |
0.122 | 0.128 | 0.0008 | 0.63 |
| Ba | 466 | 469 | 6.2 | 1.3 |
| Ce | 40.3 | 38 | 1.7 | 4.5 |
| Co | 11.7 | 11 | 0.38 | 3.4 |
| Cr | 22.4 | 23 | 0.80 | 3.5 |
| Cu | 6.81 | 6 | 0.34 | 6.1 |
| Ga | 17.1 | 16 | 0.37 | 2.3 |
| La | 20.6 | 21 | 1.5 | 7.2 |
| Nb | 5.88 | 8 | 0.23 | 2.9 |
| Nd | 17.2 | 16 | 0.82 | 5.3 |
| Ni | 14.3 | 15 | 0.32 | 2.1 |
| Pb | 11.7 | 11 | 0.45 | 4.0 |
| Rb | 67.3 | 71 | 0.28 | 0.40 |
| Sc | 8.76 | 9 | 0.99 | 10 |
| Sm | 3.39 | 3 | 0.56 | 19 |
| Sr | 379 | 367 | 0.45 | 0.12 |
| Th | 8.28 | 9 | 0.30 | 3.5 |
| V | 70.1 | 68 | 1.4 | 2.0 |
| Y | 17.3 | 18 | 0.20 | 1.1 |
| Yb | 1.77 | 2 | 0.28 | 18 |
| Zn | 46.5 | 46 | 0.34 | 0.74 |
| Zr | 144 | 152 | 0.29 | 0.19 |
Conclusions
X-ray fluorescence spectrometry is rapid, precise and accurate method to meet the requirements of silicate rock analysis. It can also minimize skill and time for the sample preparation compared to other spectroscopic analysis method which uses wet chemical technique. This note describes that XRF method with low dilution fusion technique applied to silicate rock samples can widely determine from major elements to trace elements with high accuracy.
The method covers almost all trace elements required for modern geochemical investigations. It also covers some rare earth elements.
The XRF analysis is the best method to obtain accurate and precise fundamental data required for scientific study in petrology and geochemistry. The method is also widely applicable for geological matters, such as environmental assessment of soil, exploring resources and process and quality control in mining as well as scientific investigations.

Contact Us
Whether you're interested in getting a quote, want a demo, need technical support, or simply have a question, we're here to help.