Application Note WDXRF1042
Introduction
Alloy steels with up to 4 or 8% of alloying elements added are called low alloy steels. Low alloy steels are made by adding various elements intended to improve a specific characteristic of steel such as hardenability. Alloy steels are generally made in electric furnaces. The concentration of elements in molten steel are adjusted during the process of steel making, so that rapid analysis of the elemental composition is required. As part of the control of the steel making process, analyses of slag and raw materials such as quicklime and ferroalloys are also required. X-ray fluorescence spectrometers are the most common analysis tools to analyze steel owing to rapid analysis and the ability to measure both bulk metal and powders. This application note describes low alloy steel analysis using the Supermini200, which is optimized for process control.
Instrument
The Supermini200 is a benchtop sequential wavelength dispersive X-ray fluorescence (WDXRF) spectrometer which is globally unique XRF instrument. Benchtop XRF instruments are generally energy dispersive type (EDX) because of simple configuration of optics. However, special resolution and light element sensitivity of WDX are better than those of EDX.
Supermini200 is equipped with a high power air cooled 200 watt X-ray tube, which has about 4 to 6 times higher sensitivity than a 50 watt model and enables XRF analysis with better precision.
Standard and sample preparation
The certified standard reference materials of low alloy steel provided by NIST and JSS (Japan Steel Standard) were used to establish the calibration. The samples were polished with 80-grit corundum abrasive paper. 80-grit SiC abrasive paper was used for the analysis of aluminum to avoid contamination from the corundum paper.
Measurement and calibration method
Measurements were performed using the Supermini200 with a 200 watt Pd target X-ray tube. The Kα line was measured for all elements at a counting time of 40 seconds for P and S, and 20 seconds for the other elements.
A LiF(200) analyzing crystal and scintillation counter were used for all the heavy elements from V to Mo. A PET crystal was used for Si, Al, P and S.
A gas flow proportional counter was used for all the light elements.
The representative calibration curves obtained are shown in Figure 1 to Figure 8. Overlapping correction is performed in the calibration of P to correct for overlapping of Mo as shown in a Figure 4. 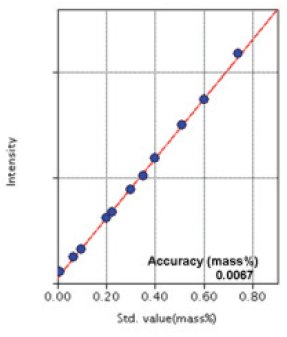
Figure 1: Calibration curve of Si
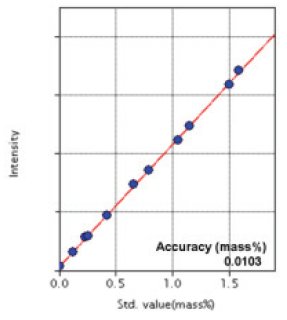
Figure 2: Calibration curve of Mn
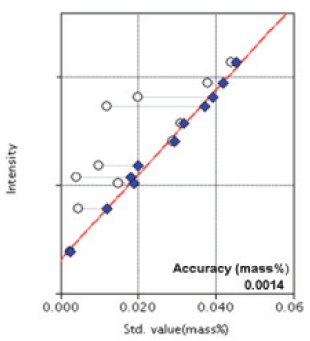
Figure 3: Calibration curve of P
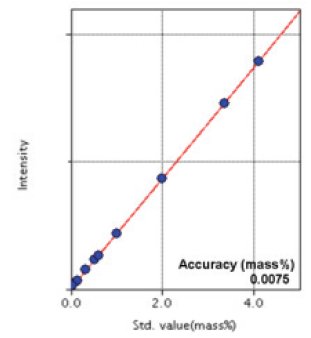
Figure 4: Calibration curve of Ni
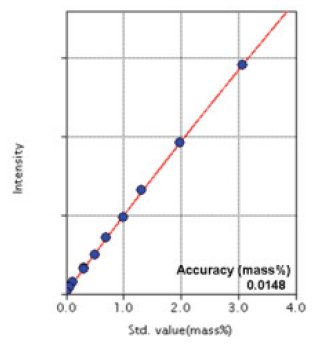
Figure 5: Calibration curve of Cr
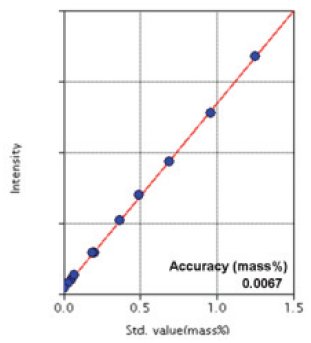
Figure 6: Calibration curve of Mo
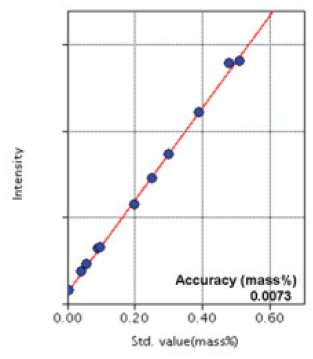
Figure 7: Calibration curve of Cu
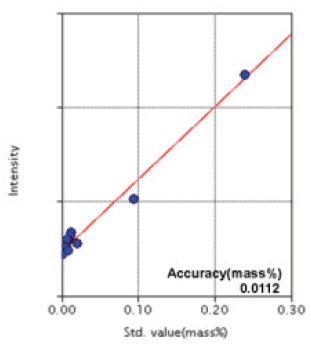
Figure 8: Calibration curve of Al
Table 1: Accuracy of calibration curves (unit: mass%)
| Component | Concentration range | Accuracy |
| Si | 0.008 - 0.732 | 0.0067 |
| Mn | 0.0057-1.59 | 0.0103 |
| P | 0.0025 - 0.044 | 0.0014 |
| S | 0.0045 - 0.041 | 0.0019 |
| Ni | 0.041 - 4.1 | 0.0075 |
| Cr | 0.0072 - 3.08 | 0.0148 |
| Mo | 0.005 - 1.25 | 0.0067 |
| Cu | 0.0058 - 0.51 | 0.0073 |
| V | 0.0006 - 0.4 | 0.0040 |
| Al | 0.0007 - 0.24 | 0.0112 |
Table 2: Result of repeatability NIST1261 (unit: mass%)
| Component | Average | Std dev. | RSD% |
| Si | 0.22 | 0.0021 | 0.95 |
| Mn | 0.67 | 0.0017 | 0.25 |
| P | 0.0135 | 0.00047 | 3.48 |
| S | 0.0143 | 0.00049 | 3.43 |
| Ni | 2.01 | 0.0064 | 0.32 |
| Cr | 0.70 | 0.0041 | 0.58 |
| Mo | 0.193 | 0.00094 | 0.49 |
| Cu | 0.045 | 0.0015 | 3.42 |
| V | 0.0103 | 0.00046 | 4.49 |
| Al | 0.0098 | 0.0012 | 12.3 |
Results
The accuracies of the calibration curves are listed in Table 1 and the repeatability of the test results (10 times) are indicated in Table 2.
The accuracy of calibration is calculated by the following conventional formula:
$Accuracy = \sqrt{ \frac{\sum_i{(C_i-\hat{C}_i)^2}}{n-m} }$
$C_i$: calculated value of standard sample
$\hat{C}_i$: reference value of standard sample
n : number of standard samples.
m: degree of freedom (linear 2, quad. 3)
Conclusions
The results show that, high precision and accurate analysis of the elements in low alloy steel can rapidly be performed using the benchtop WDX Supermini200. It is also possible to analyze high alloys such as stainless steel and nickel alloy using the Supermini200 for process control of steelmaking including the analyses of slag and ferroalloys. The Supermini200 is also effective for small commercial laboratory where various kinds of sample types are analyzed, including steels.
