Accurate Quantitative Analysis of Ferrosilicon by the Fusion Method
Introduction
Ferrosilicon is one of the most basic materials used in the steel making process. The iron alloys with the content of silicon between 15% and 90% are called "ferrosilicon", and are used in the reduction of the iron, removing oxygen and adding silicon when cast iron or steel alloys are produced. As part of controlling the steel making process, analyses of slag and raw materials such as quicklime are also required. X-ray fluorescence spectrometers are the most common analysis tools to analyze ferroalloy, slag, steel and added materials owing to the rapid analysis and the ability to measure both bulk metal and powders. This application note describes accurate ferrosilicon analysis using ZSX Primus III+, which is optimized for process control of steel making and ferrosilicon production.
Instrument
The ZSX Primus III+ has tube-above optics, where the X-ray tube is placed above sample. Tube-above optics reduces the risk of instrument contamination or damage that can occur when pressed pellet samples break inside the spectrometer while being measured or transported to the measurement position. The ZSX Primus III+ is ideal for the steel industry where both bulk metal and powder samples are analyzed as part of the process control protocol in iron and steel making such as cast iron and alloy steels. The system software is based on Rigaku’s Flowbar interface that leads the user through a series of step by step procedures to optimize and execute measurement. “EZ analysis”, another Rigaku software innovation greatly simplifies the analysis setup and sample analysis. The software has a new unique fusion bead correction function, which can correct for weight ratio difference among sample, flux and oxidation reagent, loss on ignition and gain on ignition in addition to inter-element effect. In addition, the software has various kinds of statistical process control functions ideal for the steel industry.
Standard and sample preparation
The certified reference materials of ferrosilicon provided by NIST, NCS (China National Analysis Center), AG der Dillinger Hüttenwerke (Germany), BRAMMER (U.K.) and IPT (Brazil) were used to establish the calibration. The samples include both low and high carbon ferrosilicons. The CRMs were ground for 10 minutes using a zirconia container. Since ferro-silicon powder is metal, the samples cannot be fused by a common fusion method. We have developed a special fusion technique for this application. The mixture of sample, flux and oxidation reagent in a crucible was preoxidized by heating at about 550°C for two hours prior to fusion. The samples were fused with the flux of Li₂B₄O₇, adding mixed oxidation reagent. The mixed oxidation reagent was prepared by blending LiCO₃, Na₂CO₃ and KNO₃ in equal weight. The weights of the sample, the flux and the mixture of the oxidation regents were 0.16 g, 4.0 g and 1.8 g respectively. The fusion temperature was 1200°C.
Measurement and calibration
Measurements were performed using the ZSX Primus III+ with a 3 kW Rh target X-ray tube. The Kα line was measured for all the elements. Counting time for Mg and Al is 40 seconds for peak position and 20 seconds each for two background positions. Counting time for the other elements is 20 seconds for peak position and 10 seconds each for two background positions.
An LiF(200) analyzing crystal was used for the elements of Ca, Ti, Cr, Mn, Fe and Ni. A PET was used for Si and Al. An optional Ge was used to provide high resolution for the measurement of P. A scintillation counter was used for all the heavy elements from Ti and a gas flow proportional counter was used for all the light elements.
The elements in ferrosilicon are contained as metal and all the elements are oxidized in fusion. Therefore, the elements in fused bead are contained as oxides by the oxidation, which results in large gain on ignition. In setting calibration, all elements are considered as oxide and their concentrations are converted from element into oxide. New theoretical alpha calculation software has been developed so that corrections for large gain on ignition by oxidization and adding oxidation reagent can be incorporated in the fusion bead correction.
The representative calibration curves obtained are shown in Figure 1 through Figure 8.
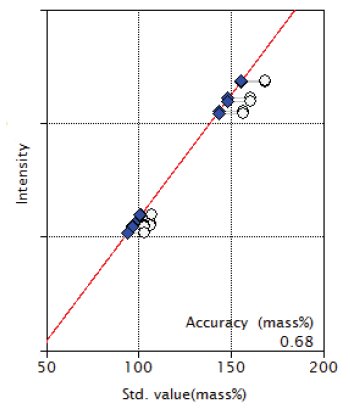
Figure 1: Calibration curve of SiO₂
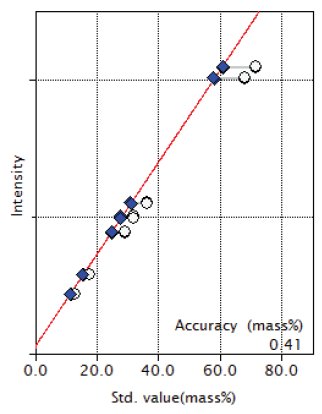
Figure 2: Calibration curve of Fe₂O₃
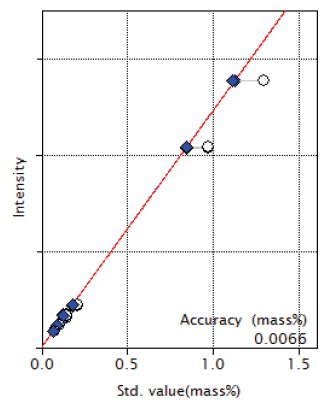
Figure 3: Calibration curve of MnO
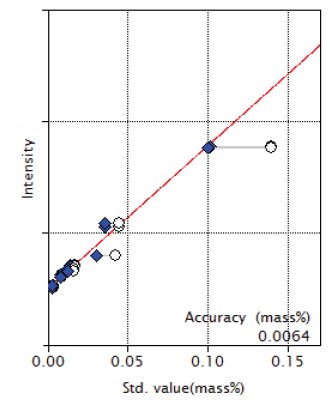
Figure 4: Calibration curve of NiO
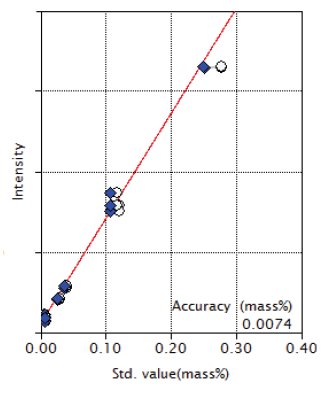
Figure 5: Calibration curve of Cr₂O₃
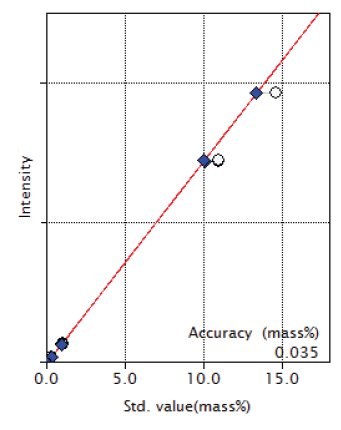
Figure 6: Calibration curve of CaO
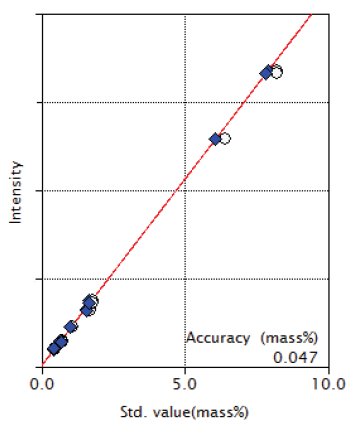
Figure 7: Calibration curve of Al₂O₃
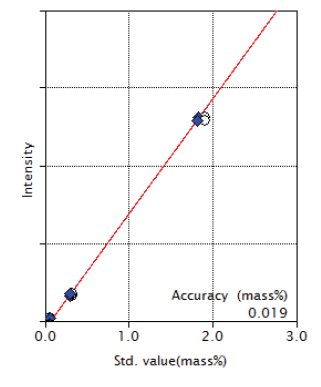
Figure 8: Calibration curve of MgO
Results
The accuracies of the calibration curves are listed in Tables 1-1 and 1-2. Table 1-2 shows the accuracies in concentration as element in the original ferroalloy samples. As shown in the figures, successful correction was made for wide ranges of concentration. Two samples in the standards contain high carbon (up to 8.31% ) and the carbon is volatilized as CO₂, which results in ignition loss during fusion. The influence of the ignition loss is effectively corrected in the calibration.
The repeatability test results (10 times) are tabulated in Tables 2-1 and 2-2. Table 2-2 shows precisions as element. The software enables the conversion of the final result output into values as element in the original ferroalloy samples.
The accuracy is calculated by the following formula:
$Accuracy = \sqrt{ \frac{\sum_i{(C_i-\hat{C}_i)^2}}{n-m} }$
$C_i$: calculated value of standard sample
$\hat{C}_i$: reference value of standard sample
n : number of standard samples.
m: degree of freedom (linear 2, quad. 3)
Table 1-1: Accuracy of calibration curves (oxide) (unit: mass%)
| Component | Concentration Range | Accuracy |
| SiO₂ | 102.89 - 168.90 | 0.68 |
| Fe₂O₃ | 12.96 -71.58 | 0.41 |
| MnO | 0.075 - 1.29 | 0.0065 |
| P₂O₅ | 0.021 - 0.057 | 0.0071 |
| NiO | 0.0036 - 0.14 | 0.0064 |
| Cr₂O₃ | 0.0064 - 0.28 | 0.0074 |
| CaO | 0.059 - 14.66 | 0.035 |
| Al₂O₃ | 0.45 - 8.24 | 0.047 |
| TiO₂ | 0.053 - 0.15 | 0.025 |
| MgO | 0.0085 - 1.91 | 0.019 |
Table 1-2: Accuracy of calibration curves (element in ferrosilicon) (unit: mass%)
| Component | Concentration range | Accuracy |
| Si | 48.1 - 78.96 | 0.31 |
| Fe | 9.06 -50.05 | 0.28 |
| Mn | 0.058 - 1.00 | 0.0050 |
| P | 0.0093 - 0.038 | 0.0030 |
| Ni | 0.0028 - 0.11 | 0.0050 |
| Cr | 0.0044 - 0.19 | 0.0050 |
| Ca | 0.042 - 10.48 | 0.025 |
| Al | 0.23 - 4.36 | 0.025 |
| Ti | 0.032 - 0.09 | 0.015 |
| Mg | 0.0051 - 1.15 | 0.011 |
Table 2-1: Result of repeatability (oxide) (unit: mass%)
| Comp. | Certified value | Average | Std. dev. | RSD% | Sample |
| SiO₂ | 103.31 | 103.61 | 0.26 | 0.25 | SL23-12 |
| Fe₂O₃ | 17.70 | 17.73 | 0.034 | 0.19 | SL23-12 |
| MnO | 0.147 | 0.144 | 0.0030 | 2.09 | SL23-12 |
| P₂O₅ | 0.046 | 0.044 | 0.0027 | 6.06 | BS140/4 |
| NiO | 0.14 | 0.14 | 0.0020 | 1.44 | BS140/4 |
| Cr₂O₃ | 0.121 | 0.125 | 0.0037 | 2.95 | SL23-12 |
| CaO | 14.66 | 14.65 | 0.039 | 0.26 | SL23-12 |
| Al₂O₃ | 6.42 | 6.42 | 0.043 | 0.66 | SL23-12 |
| TiO₂ | 0.15 | 0.16 | 0.0043 | 2.59 | BS140/4 |
| MgO | 0.320 | 0.304 | 0.013 | 4.28 | SL23-12 |
Table 2-2: Result of repeatability (element in ferrosilicon) (unit: mass%)
| Comp. | Certified value | Average | Std. dev. | RSD% | Sample |
| Si | 48.3 | 48.43 | 0.12 | 0.25 | SL23-12 |
| Fe | 12.38 | 12.40 | 0.023 | 0.19 | SL23-12 |
| Mn | 0.114 | 0.111 | 0.0023 | 2.09 | SL23-12 |
| P | 0.02 | 0.019 | 0.0012 | 6.06 | BS140/4 |
| Ni | 0.11 | 0.109 | 0.0016 | 1.44 | BS140/4 |
| Cr | 0.083 | 0.085 | 0.0025 | 2.94 | SL23-12 |
| Ca | 10.48 | 10.47 | 0.028 | 0.26 | SL23-12 |
| Al | 3.40 | 3.40 | 0.023 | 0.68 | SL23-12 |
| Ti | 0.09 | 0.10 | 0.0026 | 2.59 | BS140/4 |
| Mg | 0.193 | 0.18 | 0.0078 | 4.33 | SL23-12 |
Conclusions
The results demonstrated that ferrosilicon with wide range of composition can be accurately analyzed by the fusion method using the newly developed fusion bead correction, which corrects for the effects of large gain on ignition by oxidation of metal and loss on ignition by carbon. High precision and accuracy analysis of the elements in ferrosilicon can be rapidly performed using the ZSX Primus III+. It is also possible to analyze other ferroalloys, steels and powders, such as slag, with excellent precision using the ZSX Primus III+.

Contact Us
Whether you're interested in getting a quote, want a demo, need technical support, or simply have a question, we're here to help.