Quantitative Analysis of Blast Furnace Slag by the Pressed Powder Method
Introduction
Blast furnace slag is formed when iron ore or iron pellet, coke and flux are melted in a blast furnace of the iron foundry. The rapid chemical analysis of a blast furnace slag is an important task to control the blast furnace. X-ray fluorescence spectrometers are the most common analysis tools to analyze powder samples in iron and steel making process.
This application note describes blast furnace slag analysis using ZSX Primus III+.
Instrument
The ZSX Primus III+ has tube-above optics, where the X-ray tube is placed above sample. Tube-above optics reduces the risk of instrument contamination or damage that can occur when pressed pellet samples break inside the spectrometer while being measured or transported to the measurement position. The ZSX Primus III+ is ideal for the steel industry where both bulk metal and powder samples are analyzed as part of the process control in steel manufacturing. The system software is based on Rigaku’s Flowbar interface that leads the user through a series of step by step procedures to optimize and execute measurements. “EZ analysis”, another Rigaku software innovation greatly simplifies the analysis setup and sample analysis. In addition, the software has various kinds of statistical process control functions for the steel industry. Blast furnace slag is often analyzed by the pressed pellet method in XRF. The pressed powder method gives easy sample preparation and high repeatability results.
Standards and sample preparation
The certified reference materials of the blast furnace slag which were provided by NCS (China national analysis center), JSS (Japan) and CSMU (Czech) were used to establish the calibration. The well-dried (2 hours at 105°C) samples were ground using a grinding mill with a WC container for 2 minutes and then were pressed under the pressure 10 tons into 32 mm diameter PVC rings. Binder was not used.
Measurement and calibration
Measurements were performed using the ZSX Primus III+ with a 3 kW Rh target X-ray tube. The Kα line was measured for all the elements at the counting time of 20 seconds.
An LiF(200) analyzing crystal was used for all the elements from K to Mn. A PET was used for Si and Al, and an optional Ge was used to provide high resolution for the measurement of P and S. A scintillation counter was used for all the heavy elements and a gas flow proportional counter was used for all the light elements. An RX25 was used for Mg and Na analysis.
The calibration curves obtained are shown in Figure 1 through Figure 11.
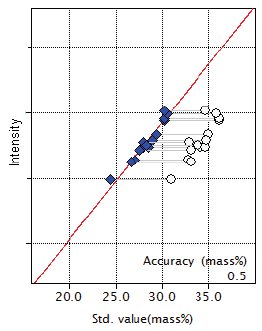
Figure 1: Calibration curve for SiO₂
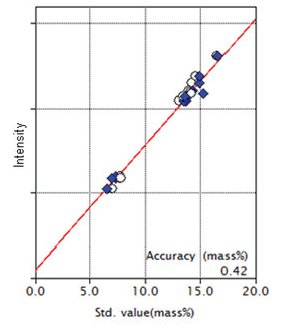
Figure 2: Calibration curve for Al₂O₃
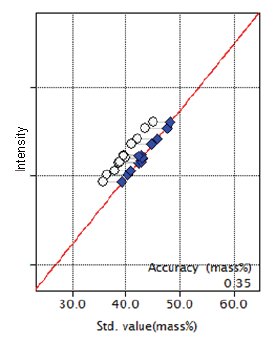
Figure 3: Calibration curve for CaO
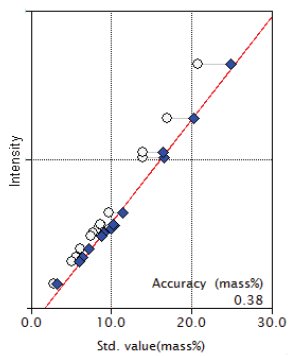
Figure 4: Calibration curve for MgO
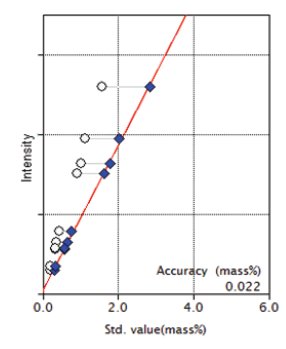
Figure 5: Calibration curve for Fe₂O₃
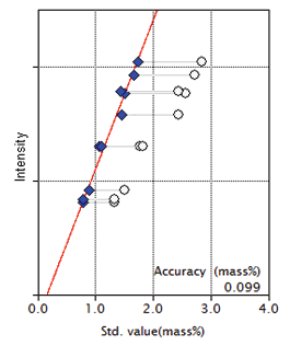
Figure 6: Calibration curve for SO₃
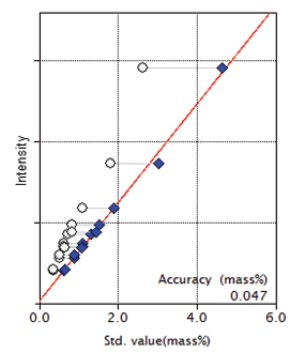
Figure 7: Calibration curve for TiO₂
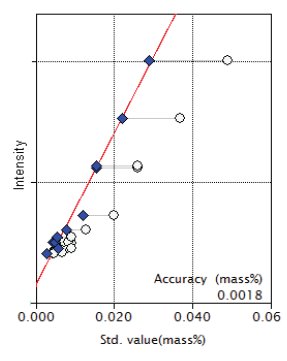
Figure 8: Calibration curve for P₂O₅
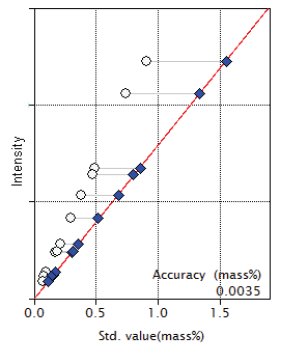
Figure 9: Calibration curve for MnO
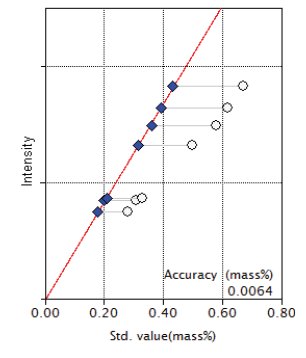
Figure 10: Calibration curve for K₂O
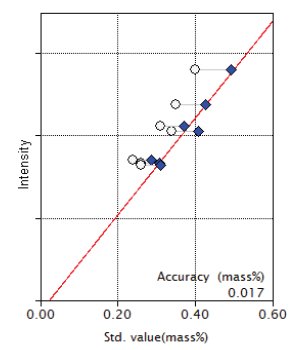
Figure 11: Calibration curve for Na₂O
Theoretical alphas obtained by the fundamental parameter method included in the software package were applied to all the calibrations to correct for absorption and enhancement effects.
Results
The accuracies of the calibration curves are listed in Table 1 and the repeatability test results (10 times) are listed in Table 2.
Table 1: Accuracy of calibration curves (unit: mass%)
| Component | Concentration Range | Accuracy |
| SiO₂ | 30.95 - 36.10 | 0.50 |
| Al₂O₃ | 7.08 - 16.48 | 0.42 |
| CaO | 35.77 - 45.00 | 0.35 |
| MgO | 2.80 - 20.77 | 0.38 |
| Fe₂O₃ | 0.19 - 2.517 | 0.022 |
| SO₃ | 1.34 - 2.85 | 0.099 |
| TiO₂ | 0.36 - 2.63 | 0.047 |
| P2O₅ | 0.005 - 0.049 | 0.0018 |
| MnO | 0.07 - 0.91 | 0.0035 |
| K₂O | 0.28 - 0.67 | 0.0064 |
| Na₂O | 0.13 - 0.40 | 0.017 |
Table 2: Result of repeatability ( unit : mass% )
| Component | Certified value | Average | Std dev. | RSD% | Sample |
| SiO₂ | 36.10 | 37.18 | 0.0495 | 0.13 | 13824 |
| Al2O₃ | 7.73 | 7.67 | 0.0141 | 0.18 | 13824 |
| CaO | 39.33 | 39.64 | 0.0222 | 0.06 | 13824 |
| MgO | 13.94 | 14.51 | 0.0248 | 0.17 | 13824 |
| Fe₂O₃ | 1.015 | 0.948 | 0.0016 | 0.17 | 13824 |
| SO₃ | 1.512 | 1.505 | 0.0033 | 0.22 | 13824 |
| TiO₂ | 0.37 | 0.35 | 0.0009 | 0.26 | 13824 |
| P₂O₅ | 0.026 | 0.026 | 0.0000 | 0.00 | 13824 |
| MnO | 0.10 | 0.107 | 0.0005 | 0.44 | 13824 |
| K₂O | 0.59 | 0.59 | 0.0008 | 0.14 | 7-1-010 |
| Na₂O | 0.18 | 0.18 | 0.0031 | 1.74 | 7-1-010 |
The accuracy is calculated by the following formula:
$Accuracy = \sqrt{ \frac{\sum_i{(C_i-\hat{C}_i)^2}}{n-m} }$
$C_i$: calculated value of standard sample
$\hat{C}_i$: reference value of standard sample
n : number of standard samples.
m: degree of freedom (linear 2, quad. 3)
Conclusions
The results show that, high precision and accurate analysis of the components in the blast furnace slag can rapidly be performed in the pressed powder method using ZSX Primus III+. In addition, the ZSX Primus III+ can be applied to various kinds of materials such as iron and sintered ores, coke, limestone and pig iron for the process control in iron foundry.

Contact Us
Whether you're interested in getting a quote, want a demo, need technical support, or simply have a question, we're here to help.