Analysis of Iron Ores by Oressed Powder Method
Introduction
Iron ore is the most abundant mineral resource and is also one of the most important materials in modern industries. Since the amount of seaborne trade and price is increasing in recent years, analytical requirements become more stringent. Total iron concentration in iron ore is focal point for trading. Therefore analysis for determination of total iron requires high accuracy.
In the mining site, laboratory analysis covers quality check for Run-of-Mine and products, grade check for beneficiation and blending and also research for area exploration. Similarly, iron ore analysis is required in pelletizing plants near mining site and also sintering plants and stockyards in steel manufacturing sites. Wet chemical analysis is the traditional analytical technique for total iron determination but it needs analytical skill and is time-consuming. The requirement for analysis is strongly focused on cost-efficient parameters such as speed of analysis, simplicity and accuracy.
For powder samples in X-ray fluorescence spectrometry, the pressed powder method is the best solution in terms of quickness and simplicity. Since iron ore has complex matrix owing to its varied mineral composition, appropriate corrections for these matrix effects are required in XRF analysis. Conventional correction technique for total iron is a method using Compton scattering as internal standard (Compton scattering ratio method) but it has not been rigorous enough to meet the requirement of the iron ore industry. Rigaku developed an improved Compton scattering method by integration of theoretical alpha corrections so that analytical result is significantly improved.
This note demonstrates improved method to determine total iron in natural and processed iron ores by pressed powder method.
Instrument
The ZSX Primus III+ is a floor-standing sequential wavelength dispersive X-ray fluorescence (WDXRF) spectrometer, which has advantages of high spectral resolution and high sensitivity in light elements. The instrument is designed to provide reliable production control and flexibility for a wide range of applications. The ZSX Primus III+ is equipped with a 3 kW Rh target X-ray tube and three analyzing crystals covering from oxygen to uranium. Additional analyzing crystals are also available for boron to nitrogen analysis.
It has intelligent auto sample changer (ASC). The ASC is upgradable to 48 samples for demand.
The ZSX Primus III+ is optimized for powder sample analysis by adopting tube-above optics. It minimizes the contamination from sample breaks during powder sample measurements. The tube-above optics also enables the users to make pellets without any binding agents or with less binding agent than usual. It simplifies sample preparation and reduces labor hours and is even more cost-effective by reducing binding agent usage. A powder trap attachment is used to improve and to minimize vacuum troubles caused by lose powder particles from powder sample. Operation software is further improved by regarding easy-to-use operation. The flowbar operation for the setting-up of quantitative analysis fully supports non-technical users.
“Quant Scatter FP” is a unique function integrated into the Rigaku FP system. It is possible to generate theoretical alphas in internal standard method by using X-rays applied to heavy element analysis in some ores.
Standard and sample preparation
The standard samples used for calibration were commercially available six certified reference materials (CRMs) supplied from the Japan Iron and Steel Federation (JISF) and the Bureau of Analysed Samples Ltd (BAS). These standards are composed of hematite ore, sintered ore, pellet and pure iron oxide. Range of total iron concentration in these CRMs is wide from 39.8 to 69.8 in mass%.
The well-dried (2 hours at 105 degrees C) samples were weighed and mixed with binder in a ratio of 2.5 % by mass. They were ground in tungsten carbide container and then pressed under pressure of 250 kN using sample cup. Generally, binders affect the analysis results in the method using scattering X-rays as internal standard. Therefore, it is strongly recommended to press samples without any binder when the scattering X-ray method as internal standard is applied to such an application requiring high accuracy. However, there is requirement to use binders at the making pellet in measuring by tube-below instruments. This note shows also results of comparison between pelletizing with and without binder.
Measurement and calibration
The ZSX Primus III+ with a 3 kW Rh target X-ray tube was used to measure the element lines of Fe, Si, Al, P, Mg, S, Ca, K, Ti, Mn, V and Rh-Kα Compton scattering (peak intensity only). For the Fe-Kα measurement, attenuator was used to obtain appropriate intensity without changing tube loading. Optional analyzing crystal Ge was used for phosphorus and sulfur measurement. Counting time for each element line was 40 s except for Fe which was 20 s.
Calibration equation for “total iron” is as following:
$W_{Fe} = (AI_R^2+BI_R+C)\cdot(1+\sum{α_jW_j})$
$I_R = I_{Fe}/I_{Compton}$
$α_j$: theoretical alpha of element j
$W_j$: weight fraction of element j
$I_{Fe}$: intensity of Fe-Kα line
$I_{Compton}$: intensity of Rh-Kα Compton line
Matrix correction coefficient (alpha) applied to the matrix correction in the calibrations were theoretically calculated by built-in FP software. The theoretical alphas for total iron calibration were calculated in consideration of Compton scattering ratio by Quant Scattering FP function integrated to FP software.
Results
The accuracy of total iron calibration without using binder obtained in this study is excellent as shown in Figure 1. 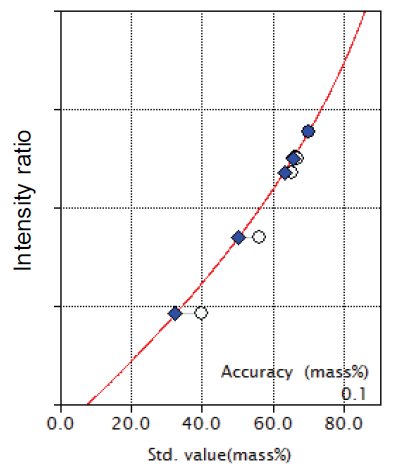
Figure 1: Calibration curve of total iron using Compton scattering ratio with theoretical alpha correction (no binder sample) open circle: uncorrected point; filled diamond: point with correction
Table 1: Accuracy and binder condition
| Binder | Mixture proportion to sample | Accuracy of calibration in T.Fe (mass%) |
| Polymer | 11% | 0.20 |
| Organic compound | 11% | 0.17 |
| Inorganic compound | 11% | 0.19 |
| Saccharide | 2.5% | 0.09 |
| None | 0% | 0.10 |
Note the difference in accuracy between the tests with high binder content and others. Same CRMs were used for each test.
The result is comparative to the calibration accuracy in pressed pellets prepared using 2.5% of binder. On the contrary, accuracies obtained from pellets using some binders with the usual mixing ratio (11%) are 0.17 – 0.20 mass% (Table 1). It indicates that, for the Compton scattering ratio method, it is necessary to minimize binder usage.
Calibration accuracies for all components measured in this study are listed in Table 2.
Table 2: Accuracy of the calibration curve. Unit: mass%
| Component / element | Concentration range | Accuracy |
| Total Fe | 39.76-69.84 | 0.10 |
| SiO₂ | 1.70-13.69 | 0.11 |
| CaO | 0.039-17.78 | 0.074 |
| Mn | 0.018-1.07 | 0.0017 |
| Al₂O₃ | 0.38-6.42 | 0.13 |
| TiO₂ | 0.044-0.48 | 0.0076 |
| MgO | 0.018-1.92 | 0.074 |
| P | 0.014-0.59 | 0.0027 |
| S | 0.002-0.115 | 0.0002 |
| K₂O | 0.007-0.52 | 0.0029 |
| V | 0.004-0.46 | 0.0053 |
The accuracy is calculated by the following formula
$Accuracy = \sqrt{ \frac{\sum_i{(C_i-\hat{C}_i)^2}}{n-m} }$
$C_i$: calculated value of standard sample
$\hat{C}_i$: reference value of standard sample
n : number of standard samples.
m: degree of freedom (linear 2, quad. 3)
To evaluate this correction method, two types of processed iron ores in CRMs were analyzed. Measurements were performed for duplicated pressed pellet samples. The results are shown in Table 3 and 4.
Table 3: Analysis result of pellet ore. Unit: mass%
| Component/ element | Certified value | duplicate 1 | duplicate 2 | ||
| XRF | Diff. | XRF | Diff. | ||
| Total Fe | 65.41 | 65.484 | 0.074 | 65.460 | 0.050 |
| SiO₂ | 2.29 | 2.414 | 0.124 | 2.405 | 0.115 |
| CaO | 2.49 | 2.610 | 0.120 | 2.610 | 0.120 |
| Mn | 0.039 | 0.040 | 0.001 | 0.040 | 0.001 |
| Al₂O₃ | 0.54 | 0.539 | 0.001 | 0.547 | 0.007 |
| TiO₂ | 0.14 | 0.143 | 0.003 | 0.142 | 0.002 |
| MgO | 0.49 | 0.489 | 0.001 | 0.489 | 0.001 |
| P | 0.043 | 0.044 | 0.001 | 0.044 | 0.001 |
| S | 0.003 | 0.003 | 0.000 | 0.003 | 0.000 |
| K₂O | 0.098 | 0.094 | 0.004 | 0.094 | 0.004 |
| V | 0.19 | 0.186 | 0.004 | 0.192 | 0.002 |
Table 4: Analysis result of sintered ore. Unit: mass%
| Component/ element | Certified value | duplicate 1 | duplicate 2 | ||
| XRF | Diff. | XRF | Diff. | ||
| Total Fe | 56.16 | 56.062 | 0.098 | 56.156 | 0.004 |
| SiO₂ | 5.41 | 5.232 | 0.178 | 5.237 | 0.173 |
| CaO | 9.91 | 9.860 | 0.050 | 9.886 | 0.024 |
| Mn | 0.263 | 0.263 | 0.000 | 0.265 | 0.002 |
| Al₂O₃ | 2.01 | 1.821 | 0.189 | 1.831 | 0.179 |
| TiO₂ | 0.31 | 0.318 | 0.008 | 0.318 | 0.008 |
| MgO | 1.62 | 1.688 | 0.068 | 1.699 | 0.079 |
| P | 0.06 | 0.056 | 0.004 | 0.057 | 0.003 |
| S | 0.012 | 0.012 | 0.000 | 0.012 | 0.000 |
| K₂O | 0.036 | 0.037 | 0.001 | 0.037 | 0.001 |
| V | 0.031 | 0.038 | 0.007 | 0.038 | 0.007 |
Conclusions
X-ray fluorescence spectrometry is rapid, precise and accurate method to meet the requirements of iron ore industry. It can also minimize cost and time in iron ore analysis.
This application note demonstrated that this method is practically applicable with little dependence on mineral compositions. It also indicates that the pressed powder method with Rigaku’s advanced correction technology is widely available for iron ore industry such as supplier, producer and steel manufacturer with higher cost-efficiency and higher throughput than conventional method

Contact Us
Whether you're interested in getting a quote, want a demo, need technical support, or simply have a question, we're here to help.