Thermal Decomposition of Polyolefins
Introduction
Polyolefins, such as polyethylene (PE, Fig. 1(a)) and polypropylene (PP, Fig. 1(b)), have been produced for various uses such as packaging, textiles, plastic parts, and so on. A great amount of polyolefins has turned into wastes nowadays. The information about the thermal decomposition of polyolefins is important for recycling and incineration of polyolefin wastes. Here, we have investigated the thermal decomposition of PE and PP by Thermo Mass Photo.
Instrument: Thermo Mass Photo
Thermo Mass Photo is a versatile measurement system of thermogravimetry-differential thermal analysis (TG-DTA) and photoionization mass spectrometry (PIMS). In this system, weight change, endothermic or exothermic phenomena, and evolved gases can be analyzed simultaneously. Therefore, Thermo Mass Photo is considered a promising analytical tool for fundamental research, qualification control, and de- velopment of new materials.
Thermo Mass Photo has a unique interface, called skimmer type interface, which transfers evolved gases efficiently. We can select Photoionization (PI) as well as Electron ionization (EI) on the mass spectrometer. The combination of PI and EI enables us to identify the gases easily.
Experimental
Standard samples of PE and PP were placed into Al pans, and heated at 20ºC/min under He atmosphere. Their reactions were monitored by TG, DTA, and MS in Thermo Mass Photo.
Results and discussion
PE
Figure 2 shows the TG-DTA curves of high-density PE (HDPE), low-density PE (LDPE), and oxidized PE (OxPE). Each sample is decomposed completely up to 500ºC. However, they show the different temperatures for their initial weight loss. OxPE starts to decompose with low temperature compared to LDPE and HDPE. OxPE may have the shortened main PE chain due to the oxidation.
HDPE and LDPE show the endothermic peaks for the fusion at 127.8 and 111.2ºC, respectively. The endothermic peaks around 480ºC are attributed to the thermal decompositions of PEs.
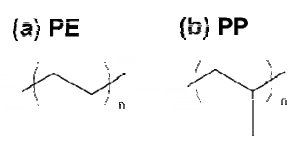 Figure 1. Structural formula of (a) PE and (b) PP.
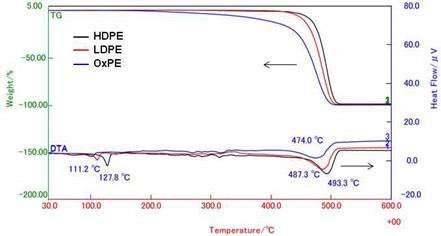 Figure 2. TG-DTA curves of PEs.
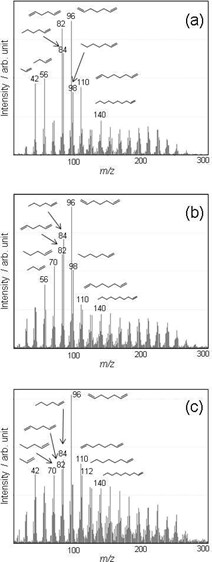 Figure 3. PI mass spectra of (a) HDPE, (b) LDPE, and (c) OxPE at the thermal decomposition temperature.
Figure 3 shows the mass spectrum of each sample with PI at the decomposition temperature. The PEs evolve in various aliphatic hydrocarbons with different carbon numbers (C3, C4, C5...). The pattern of the mass spectrum, which reflects the distribution of the decomposition products, depends on each PE. The MS ion thermograms, which exhibit the evolved gases as a function of temperature, are shown in Figure 4. Figure 4 indicates that decene (m/z 140), one of the decomposition products, is evolved corresponding to the weight loss in each PE. The sequence of the peak temperatures is as follows:
OxPE < LDPE < HDPE
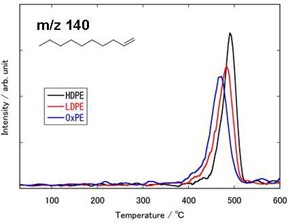 Figure 4. MS ion thermogram of decene (m/z 140) in the PEs.
PP
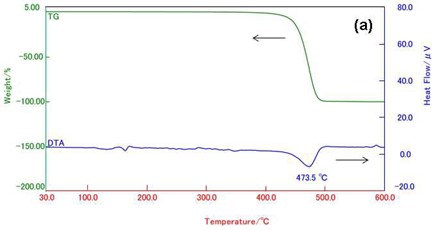
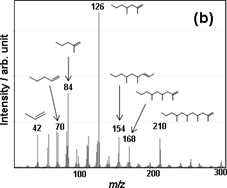
Figure 5(a) shows the TG-DTA curves of PP. PP shows the weight loss of 100 % around 470ºC. At this temperature, some evolved gases due to the thermal decomposition of PP are detected as shown in Fig. 5(b). PP also evolves various aliphatic hydrocarbons.

Contact Us
Whether you're interested in getting a quote, want a demo, need technical support, or simply have a question, we're here to help.