Thermal Decomposition of Polyvinyl Resins
Introduction
Polyvinyl resins, such as polyvinyl chloride (PVC, Figure 1(a)), polyvinyl acetate, and polyvinyl alcohol (PVA, Figure 1(b)), are produced by the polymerization of some sorts of vinyl monomers. Polyvinyl resins have been produced for various uses, and eventually become waste. We must take care of their incineration, espe-cially PVC because of the evolution of harmful gases such as HCl and organic halogen compounds. In this measurement, we have examined the thermal decomposition of PVC and PVA by Thermo Mass Photo.
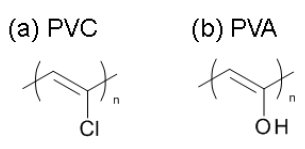
Figure 1: Structural formula of (a) PVC and (b) PVA.
Instrument: Thermo Mass Photo
Thermo Mass Photo is a versatile measurement system of thermogravimetry-differential thermal analysis
(TG-DTA) and photoionization mass spectrometry (PIMS). In this system, weight change, endothermic or exothermic phenomena, and evolved gases can be analyzed simultaneously. Therefore, Thermo Mass Photo is considered a promising analytical tool for fundamental research, qualification control, and development of new materials.
Thermo Mass Photo has a unique interface, called skimmer type interface, which transfers evolved gases efficiently. We can select Photoionization (PI) as well as Electron ionization (EI) on the Mass spectrometer (MS). The combination of PI and EI enables us to identify the gases easily.
Experimental
Standard samples of PVC and PVA were placed into Al pans with 4 mg, and heated at 20ºC/min under He atmosphere. Their reactions were monitored by TG, DTA, and MS in Thermo Mass Photo.
Results and Discussion
PVC
Figure 2 shows the TG-DTA profile of PVC. PVC exhibits the two-step weight loss during the heating. On the first weight loss in the temperature range from 250 to 400 ºC, HCl and aromatic compounds such as benzene and naphthalene are evolved. Other aro-matic compounds such as toluene and xylene are evolved on the second weight loss in the temperature range from 400 to 550ºC. The MS ion thermograms in Figure 3 demonstrate the profile of each evolved gas as a function of temperature.
The thermal decomposition of PVC induces desorption of HCl followed by the formation of polyene structure. Then the various aromatic compounds are produced by the cyclization of the polyene.
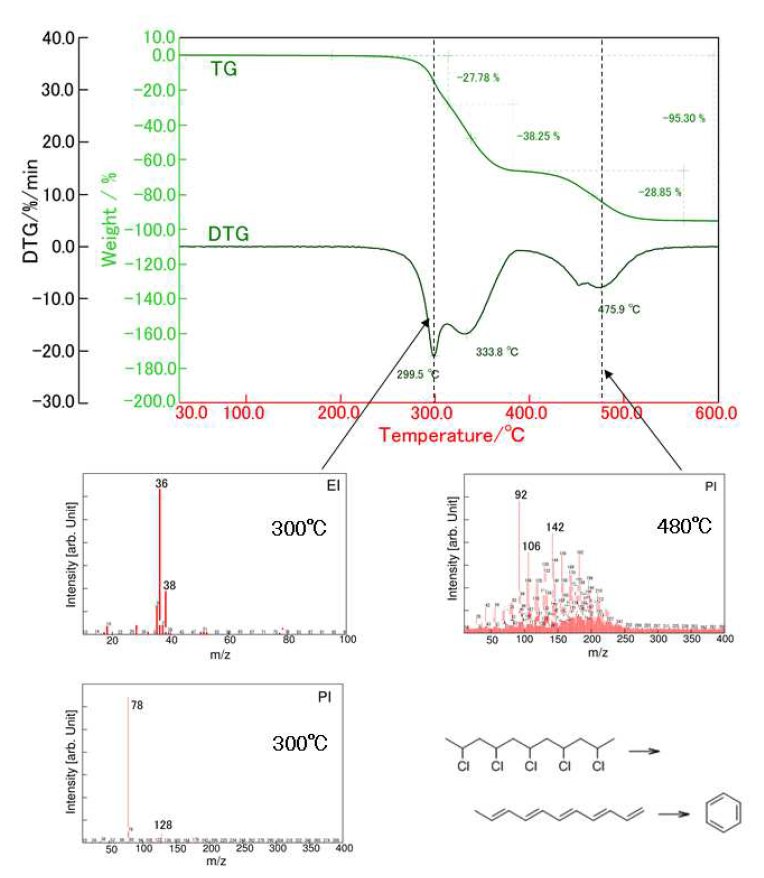
Figure 2: TG-DTA profile of PVC and MS spectra of 300ºC and 450ºC.
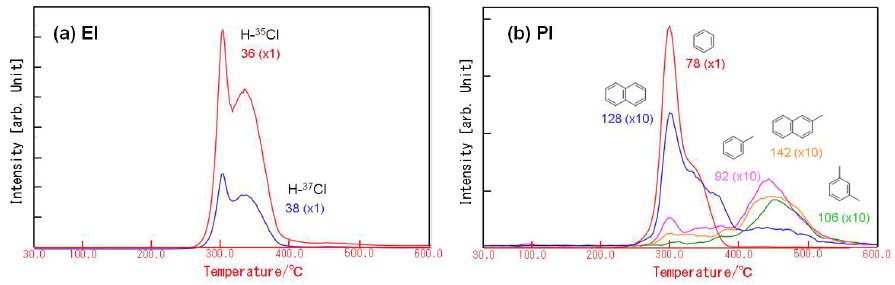
Figure 3: MS ion thermograms of PVC for (a) EI and (b) PI.
PVA
Figure 4 shows the TG-DTA profile of PVA. PVA re-veals the first weight loss of 73% around 280ºC and the second weight loss of 13% around 450ºC. On the 1st weight loss, H₂O and aldehyde compounds are evolved as shown in Figure 5. These evolved gases are produced on the following reactions:
- The aldehyde groups are formed by the dissociation of the polymer chain.
- The conjugated double bonds (polyene structure) are formed by the dehydration.
Aromatic aldehyde compounds are mainly evolved on the second weight loss. These gases are produced by the cyclization of the polyene.
From 30 to 250ºC, we observed the 5% weight loss accompanied with the evolution of H₂O. PVA ad-sorbed large amounts of H₂O due to its high hydrophilicity.
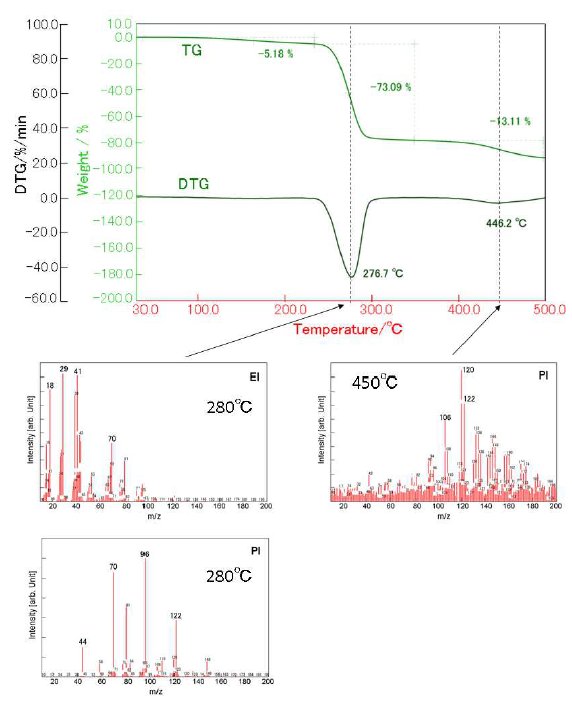
Figure 4: TG-DTA profile of PVA and MS spectra of 280ºC and 450ºC.
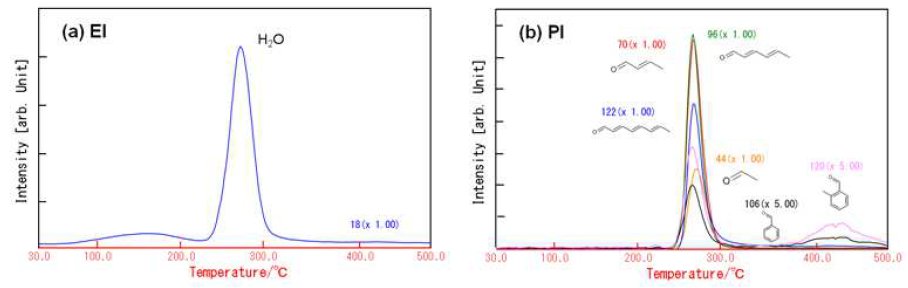
Figure 5: MS ion thermograms of PVA

Contact Us
Whether you're interested in getting a quote, want a demo, need technical support, or simply have a question, we're here to help.