Determination of Compounding Ratio for Complex Material, Nylon
Introduction
The detection or analysis of the gases evolved during a chemical reaction, as a function of temperature, constitute the techniques of thermal analysis called evolved gas detection (EGD) and evolved gas analysis (EGA), respectively.
Thermal analysis using mass spectrometry covers a large number of related and analytical powerful techniques such as evolved gas analysis using mass spectrometry (EGA-MA) including thermogravimetry-mass spectrometry (TG-MS), temperature programmed pyrolysis-mass spectrometry and temperature programmed desorption mass spectrometry.
In conventional EGA-MS, the evolved gaseous products, which are introduced rapidly to MS, are generally ionized by electron ionization (EI) at 70 eV. In this case, a part of the evolved gaseous molecular ion undergoes further decomposition, and observed simultaneously ions. Especially in the thermal processes, since the evolved gases consists of multiple gaseous species in almost all cases, the resulting fragment ions are overlapped, while the fragment ions provide significant information concerning the structure of the molecule, the apparent mass spectra can be quite complicated. In order to differentiate in real-time the multiple organic species that are evolved in the thermal process, one feasible approach is the use of MS with a selective and soft (fragment-free) ionization technique which avoids fragmentation during ionization.
Differential thermogravimetry photoionization mass spectrometer simultaneous measurement system (ThermoMass Photo) can detect the molecular ion without fragment, the system is applied the gaseous detector to photoionization mass spectrometer which coupled with TG-DTA-MS.
In the present work, we determined the compounding ratio for a complex material, nylon, employing ThermoMass Photo.
Instrument: ThermoMass Photo
ThermoMass Photo is an evolved gas analytical system designed for real-time simultaneous measurements of thermogravimetry – differential thermal analysis (TG-DTA) coupled with electron impact ionization (EI) and the fragment-free photoionization (PI) mass spectrometry (MS) that performs measurements as a function of temperature or time.
Measurement and analysis
Comparisons between the results from EIMS and PIMS for pyrolysate of 2 types of nylon obtained by EI/PIMS are shown in Figure 1.
The observed EI mass spectra seem similar to each other, it is difficult to directly characterize them and to differentiate the individual nylons. On the other hands, the PI spectra are composed of only molecular ions from the degradation products that originate from the polymer backbone structure, the individual nylons can be definitively identified. Hence, Nylon 6 and Nylon66 are m/z; 113 of caprolactam and m/z; 84 of cyclopentanone, respectively.
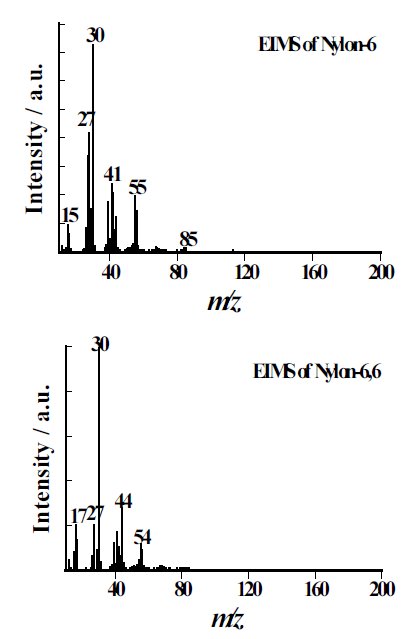
Figure 1(a): A comparison of mass spectra for nylons - EI spectrum
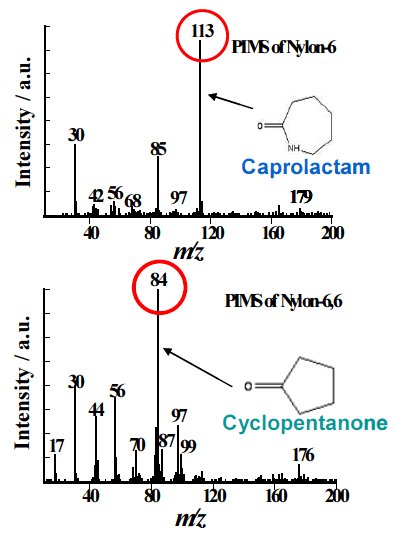
Figure 1(b): A comparison of mass spectra for nylons - PI spectrum
We have made a study on possibility of compounding ratio for complex material.
The study is observed at the caprolactam for Nylon6 and the cyclopentanone for Nylon66, and then measured at PIMS about known samples of compounding ratio for complex material. The measurement results are shown in Fig ure2. As the Nylon6 increases, the caprolactam increases, and this tendency is observed in between Nylon66 and the cyclopentanone as same.
The caprolactam and the cyclopentanone of peak area are plotted as Nylon6 and Nylon66 of compounding ratio which are shown in Figure 3. The measurement results show good linear relation.
Each peak intensity is proportional to compounding ratio, hence in the results, these are available to use as standard curve and identify the compounding ratio of complex material.
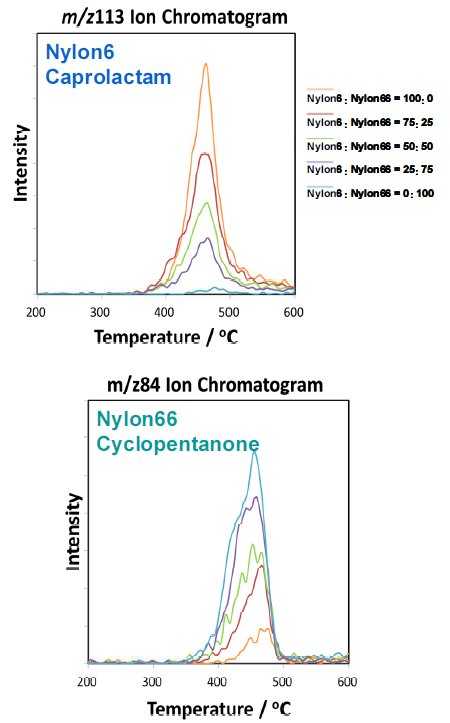
Figure 2: Mass spectra of nylons of different compounding ratios conducted at PI MS
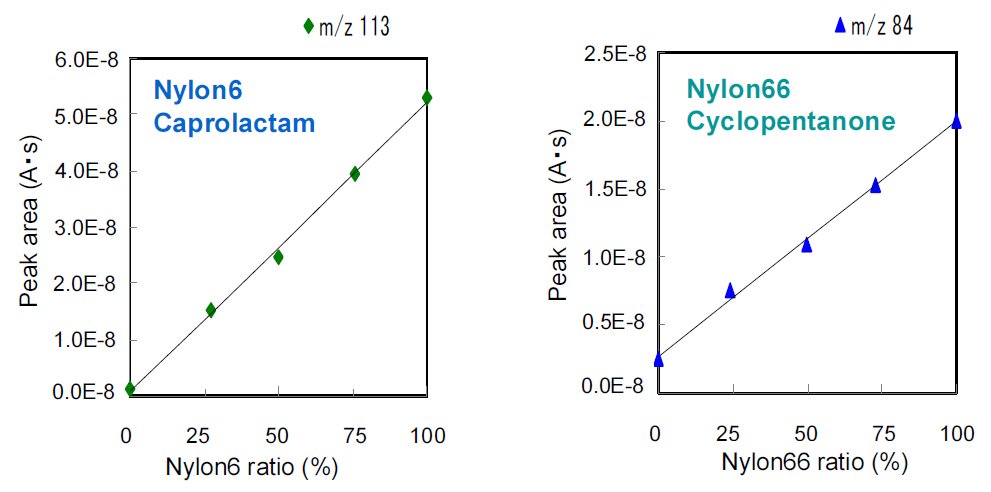
Figure 3: Plot of peak area and compounding ratio for nylons

Contact Us
Whether you're interested in getting a quote, want a demo, need technical support, or simply have a question, we're here to help.