Comparison of Two XtaLAB Synergy Instruments
Introduction
Many research and service crystallography laboratories use single crystal diffractometers equipped with two different wavelengths. Typically, CuKα and MoKα are used but also combinations with AgKα are becoming popular. The choice of wavelength for a diffraction experiment is always a tradeoff between intensity, resolution and absorption for sample at hand. Rigaku Oxford Diffraction offers a unique rotating anode system, featuring two wavelengths to overcome these tradeoffs. The intensity gain between a microfocus sealed tube instrument and a rotating anode is in the range of a factor 10-12, depending on the wavelength. By curving the detector around the sample, higher coverage of reciprocal space can be achieved. Additionally, reflections hit the sensor of the detector with a lower obliqueness, thus creating sharper and better-defined spots. Fewer corrections in the data processing are required, therefore the overall data quality is improved.
This application note compares two differently configured XtaLAB Synergy instruments, (Figure 1) covering the middle to high range of single crystal diffraction equipment.
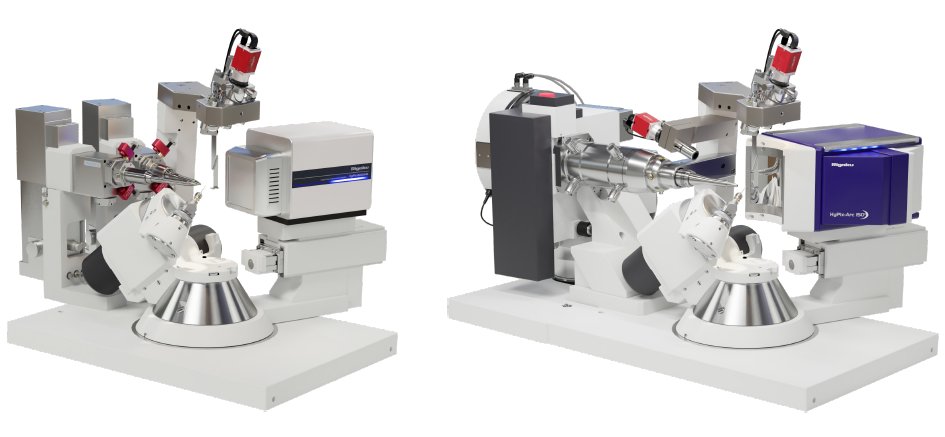
Figure 1: (a) XtaLAB Synergy-S, equipped with a HyPix-6000HE and (b) XtaLAB Synergy-DW, equipped with an HyPix-Arc 150° detector. Low temperature devices are omitted for clarity.
Experimental
Each instrument is equipped with CuKα and MoKα wavelengths, which will be tested using carefully selected crystals of cytidine and PdCl2(dppf) as examples for a small, organic, chiral molecule and a common metal-organic complex (dppf: 1,1’-bis(diphenylphosphino)ferrocene). For comparison, both datasets aimed for an equal redundancy and intensity of data. The measurements were conducted at 100 K, using Oxford Cryostream 800 series cryo-coolers. The crystals were kept frozen under liquid nitrogen between the measurements to prevent sample degradation.
Results
Cytidine
A colorless block-shaped crystal was cut from a larger block to a size of 0.063 x 0.064 x 0.087 mm, see Figure 2.
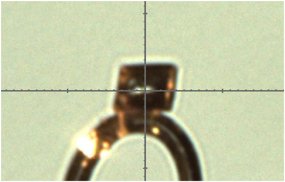
Figure 2: Photo of the cytidine crystal used for comparison.
The number of measured frames reflects the influence of detector size: the HyPix-Arc 150° dataset needed around 20% fewer frames than the HyPix-6000HE (7570 vs 6106). Due to the size of the detector, the HyPix-6000HE dataset was collected in two principal theta positions, whilst the HyPix-Arc 150° dataset could be collected in a single principal theta position, see Table 1.
Table 1: Comparison results for the cytidine crystal, Cu-Kα.
| Instrument Setup | (a) | (b) |
| Experimental | ||
| Runs / Frames | 60/7570 | 44/6106 |
| Scan width [°] | 0.5 | 0.5 |
| Exposure time [s] | 0.29 / 1.16 | 0.05 |
| Total experiment time [hh:mm:ss] | 02:06:07 | 00:17:07 |
| Data quality (inf - 0.84 Å) | ||
| Completeness [%] | 100 | 100 |
| Redundancy | 15.7 | 15.6 |
| I/ σ(I) | 104.6 | 122.0 |
| Rint [%] | 3.21 | 2.45 |
| R₁ [%] | 2.20 | 2.36 |
| wR₂ [%] | 5.84 | 6.23 |
| Flack [x] | 0.01(3) | 0.03(4) |
Due to the high photon flux of the rotating anode, even the high angle reflections could be measured at 0.05 s/0.5°, resulting in a performance increase of factor 23.2 (exposure time 1.16 s vs 0.05 s per frame). Comparing the I/σ(I) of the highest resolution shells, (Tables 2 & 3) equally intense data was collected (47.78 vs 47.24). The overall redundancy distribution over all resolution shells differs, which is due to the size difference between the detectors: While measuring complete data on high resolution shells, redundancy on inner shells is collected as a by-product in the case of HyPix-Arc 150°.
Table 2: Statistics vs. Resolution (taking redundancy into account) – point group symmetry P222: XtaLAB Synergy-S with HyPix-6000HE.
| Resolution (Å) | # measured | Completeness | Redundancy | Mean F² | Mean F²/σ(F²) | Rint | Rpim | CC 1/2 | |$F_+^2$ -$F_-^2|/σ$ |
| inf- 1.84 | 2558 | 100 | 13.8 | 70097.62 | 109.70 | 0.027 | 0.008 | 1.000 | 1.74 |
| 1.84- 1.45 | 3952 | 100 | 21.2 | 30454.53 | 108.31 | 0.030 | 0.007 | 1.000 | 1.89 |
| 1.45- 1.25 | 4396 | 100 | 23.6 | 18519.33 | 95.05 | 0.036 | 0.007 | 1.000 | 1.79 |
| 1.25- 1.14 | 4256 | 100 | 22.9 | 19496.39 | 88.69 | 0.037 | 0.008 | 1.000 | 2.11 |
| 1.14- 1.06 | 3817 | 100 | 20.5 | 19149.88 | 84.94 | 0.036 | 0.008 | 1.000 | 1.89 |
| 1.06- 0.99 | 3018 | 100 | 16.2 | 13157.62 | 72.33 | 0.040 | 0.010 | 0.999 | 2.27 |
| 0.99- 0.95 | 2264 | 100 | 12.2 | 8662.95 | 64.92 | 0.038 | 0.011 | 0.999 | 1.96 |
| 0.95- 0.91 | 2090 | 100 | 11.2 | 6679.30 | 55.43 | 0.041 | 0.013 | 0.999 | 1.93 |
| 0.91- 0.87 | 1710 | 100 | 9.2 | 7250.33 | 55.36 | 0.038 | 0.013 | 0.999 | 1.91 |
| 0.87- 0.84 | 1438 | 99.5 | 7.5 | 4853.98 | 47.78 | 0.044 | 0.017 | 0.999 | 1.81 |
| inf- 0.84 | 29499 | 99.9 | 15.8 | 21350.19 | 83.82 | 0.033 | 0.008 | 1.000 | 1.94 |
Table 3: Statistics vs. Resolution (taking redundancy into account) – point group symmetry P222: XtaLAB Synergy-DW with HyPix-Arc 150°.
| Resolution (Å) | # measured | Completeness | Redundancy | Mean F² | Mean F²/σ(F²) | Rint | Rpim | CC 1/2 | |$F_+^2$ -$F_-^2|/σ$ |
| inf- 1.84 | 4815 | 100 | 25.9 | 864626.16 | 210.59 | 0.019 | 0.004 | 1.000 | 2.75 |
| 1.84- 1.45 | 3785 | 100 | 20.3 | 350178.21 | 126.28 | 0.023 | 0.005 | 1.000 | 1.81 |
| 1.45- 1.25 | 3777 | 100 | 20.3 | 211852.79 | 99.84 | 0.028 | 0.006 | 1.000 | 1.80 |
| 1.25- 1.14 | 3401 | 100 | 18.3 | 224944.24 | 89.24 | 0.028 | 0.007 | 1.000 | 1.86 |
| 1.14- 1.06 | 2844 | 100 | 15.3 | 220427.33 | 80.88 | 0.030 | 0.008 | 1.000 | 1.75 |
| 1.06- 0.99 | 2010 | 100 | 10.8 | 144638.65 | 61.02 | 0.036 | 0.011 | 0.999 | 1.76 |
| 0.99- 0.95 | 2038 | 100 | 11.0 | 98121.76 | 50.99 | 0.040 | 0.012 | 0.999 | 1.74 |
| 0.95- 0.91 | 2451 | 100 | 13.2 | 78070.12 | 51.71 | 0.043 | 0.012 | 0.999 | 1.57 |
| 0.91- 0.87 | 2205 | 100 | 11.9 | 78893.06 | 52.69 | 0.043 | 0.013 | 0.999 | 1.83 |
| 0.87- 0.84 | 1855 | 99.5 | 9.6 | 56277.09 | 47.24 | 0.047 | 0.015 | 0.999 | 1.89 |
| inf- 0.84 | 29181 | 99.9 | 15.6 | 296120.66 | 101.43 | 0.025 | 0.006 | 1.000 | 1.85 |
The refined crystal structures are very similar in quality (R₁ = 2.20 % vs 2.36 %). Within one standard uncertainty, the Flack-parameter is equal in both measurements (Flack = 0.01(3) vs 0.03(4)). More internally consistent data was obtained from the HyPix-Arc 150° detector (Rint = 3.21 % vs. 2.45 %). A significantly lower Rint could be obtained because more symmetry equivalent reflections could be measured in the same frame, thus the scaling of data was improved. The residual electron density is found between the atoms in the covalent bonds, indicating a very high quality structure, see Figure 3.
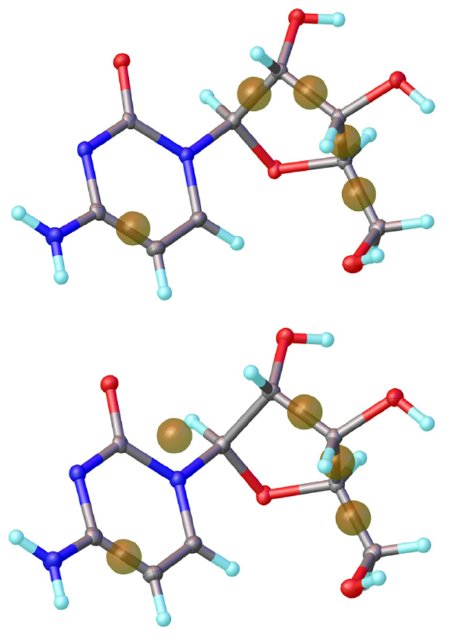
Figure 3: Refined crystal structure models of cytidine, measured on a XtaLAB Synergy-S/HyPix-6000HE (top) and a XtaLAB Synergy-DW/HyPix-Arc 150° (bottom).
PdCl₂(dppf)
A plate-like bright orange crystal of size 0.018 x 0.039 x 0.110 mm was chosen for the comparison measurements with MoKα radiation, see Figure 4.
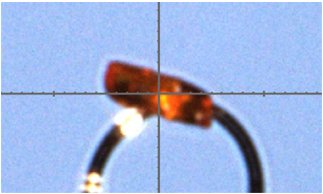
Figure 4. Photo of the PdCl₂(dppf) crystal used for comparison.
Data collection times lasted over 15 hours on the sealed tube instrument, whereas the measurement on the rotating anode finished in little over 1 hour. With a nearly equal number of frames (1256 vs 1294), the difference in exposure time, 45 s vs. 3 s, shows the performance increase of a factor 15 between the system (a) and (b), see Table 4.
Both data sets allowed for excellent refined crystal structures. The I/σ(I) as well as the Rint are slightly stronger in the sealed tube dataset, which is due to the exposure time. Ultimately the rotating anode dataset yielded an equally well refined structure model within margin: R₁ = 3.09 % vs. 3.15 %. Both structure models show residual electron density on the chemical bonds. A half molecule of MeOH could be refined without constraints on a special position, see Figure 5.
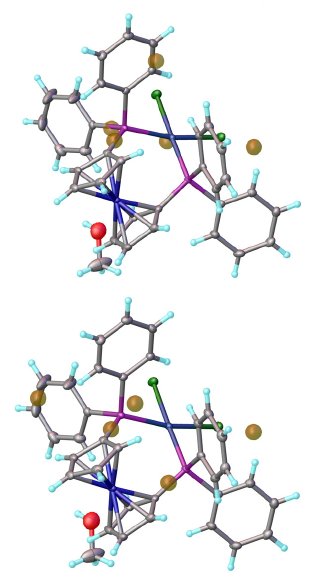
Figure 5: Refined crystal structures of PdCl₂(dppf), measured on a XtaLAB Synergy-S/HyPix-6000HE (top) and a XtaLAB Synergy-DW/HyPix-Arc 150° (bottom).
Tables 5 and 6 show statistics for both datasets. The dataset measured with the HyPix-Arc 150° shows a different redundancy distribution than the dataset measured with the HyPix-6000HE like in the Cu dataset of cytidine.
Table 5: Statistics vs. Resolution (taking redundancy into account) – point group symmetry P1: XtaLAB Synergy-S with HyPix-6000HE.
| Resolution (Å) | # measured | Completeness | Redundancy | Mean F² | Mean F²/σ(F²) | Rint | Rpim | CC 1/2 |
| inf- 1.72 | 2622 | 98.7 | 4.3 | 253.07 | 70.07 | 0.013 | 0.007 | 1.000 |
| 1.72- 1.37 | 3112 | 100 | 5.0 | 159.58 | 57.21 | 0.019 | 0.009 | 1.000 |
| 1.37- 1.20 | 3330 | 100 | 5.4 | 98.30 | 44.76 | 0.028 | 0.013 | 0.999 |
| 1.20- 1.09 | 3398 | 100 | 5.5 | 87.13 | 40.70 | 0.031 | 0.014 | 0.999 |
| 1.09- 1.01 | 3416 | 100 | 5.5 | 83.50 | 38.59 | 0.035 | 0.016 | 0.999 |
| 1.01- 0.95 | 3403 | 100 | 5.5 | 70.05 | 33.28 | 0.040 | 0.019 | 0.999 |
| 0.95- 0.90 | 3474 | 100 | 5.6 | 54.34 | 28.26 | 0.050 | 0.023 | 0.999 |
| 0.90- 0.86 | 3260 | 100 | 5.2 | 49.60 | 25.78 | 0.057 | 0.027 | 0.998 |
| 0.86- 0.83 | 2793 | 99.8 | 4.5 | 40.68 | 20.51 | 0.066 | 0.034 | 0.996 |
| 0.83- 0.80 | 2362 | 99.8 | 3.8 | 38.08 | 18.14 | 0.070 | 0.040 | 0.995 |
| inf- 0.80 | 31170 | 99.8 | 5.0 | 91.79 | 37.75 | 0.031 | 0.015 | 1.000 |
Table 6: Statistics vs. Resolution (taking redundancy into account) – point group symmetry P1: XtaLAB Synergy-DW with HyPix-Arc-150°.
| Resolution (Å) | # measured | Completeness | Redundancy | Mean F² | Mean F²/σ(F²) | Rint | Rpim | CC 1/2 |
| inf- 1.72 | 3685 | 97.4 | 6.1 | 2986.57 | 73.30 | 0.015 | 0.006 | 1.000 |
| 1.72- 1.37 | 3118 | 100 | 5.0 | 1876.14 | 53.70 | 0.020 | 0.010 | 1.000 |
| 1.37- 1.20 | 3300 | 100 | 5.3 | 1164.19 | 40.13 | 0.030 | 0.014 | 0.999 |
| 1.20- 1.09 | 3369 | 100 | 5.4 | 994.99 | 35.27 | 0.038 | 0.018 | 0.999 |
| 1.09- 1.01 | 3377 | 100 | 5.5 | 940.86 | 32.94 | 0.043 | 0.020 | 0.999 |
| 1.01- 0.95 | 3242 | 100 | 5.2 | 773.08 | 26.93 | 0.050 | 0.024 | 0.998 |
| 0.95- 0.90 | 3090 | 100 | 5.0 | 601.57 | 21.28 | 0.059 | 0.029 | 0.998 |
| 0.90- 0.86 | 2813 | 100 | 4.5 | 507.62 | 17.37 | 0.068 | 0.036 | 0.997 |
| 0.86- 0.83 | 2679 | 100 | 4.3 | 439.30 | 15.14 | 0.078 | 0.042 | 0.996 |
| 0.83- 0.80 | 2403 | 100 | 3.9 | 415.15 | 13.15 | 0.079 | 0.046 | 0.994 |
| inf- 0.80 | 31076 | 99.7 | 5.0 | 1132.52 | 34.57 | 0.033 | 0.016 | 1.000 |
Summary
Both instruments are great tools to analyze small crystals of organic and metal-organic molecules. The gain in performance between the medium range instrument XtaLAB Synergy-S with HyPix-6000HE and the higher range instrument XtaLAB Synergy-DW with HyPix-Arc 150° is in an overall range 10-15. Laboratories with small crystals or needing high throughput will benefit from an intense rotating anode source and a large, curved detector.

Contact Us
Whether you're interested in getting a quote, want a demo, need technical support, or simply have a question, we're here to help.