What Is This? and Data Collection on Metal-organic Framework Microcrystals using the XtaLAB Synergy-S
Introduction
The chemistry of metal-organic framework microcrystals (MOFs) very often produces a crystalline material that is not suitable for standard single crystal diffraction (SCX). Although quality may be improved by recrystallization, sometimes this is not possible, especially when thermal activation processes were used during MOF preparation. A mixture of powder, amorphous material, polycrystalline compounds and microcrystals is a common outcome, whick makes MOFs challenging materials both for SCX or PXRD structure determination approaches.
Thanks to very bright microfocus PhotonJet(Cu) sources and Rigaku’s HyPix detector technology used in the latest generation of XtaLAB Synergy, “What is this?” (WIT) screening can be used to find suitable single crystals for structure solution.
An example of “What is This?” screening to assist Rietveld refinement
A very small particle taken from a MOF1¹ powder gave poor diffraction quality, but a discrete diffraction pattern was still observable and manually indexed. Thanks to HyPix technology and CrysAlisPro smart algorithms, the WIT² dataset gave a reasonable space group and solution in less than one hour (Figure 1). This solution was later confirmed by Rietveld refinement on the bulk powder sample.
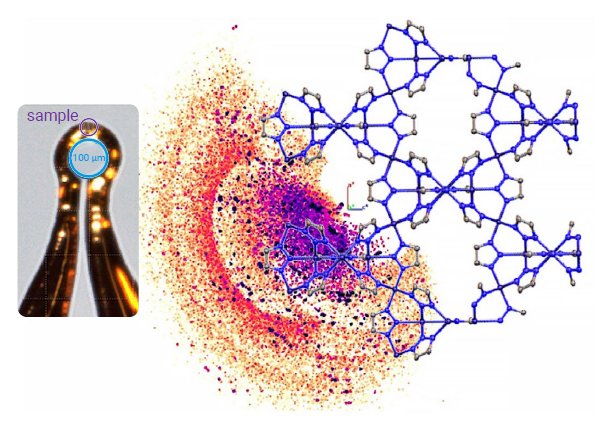
Figure 1: A view of a loop with a mounted sample, the Ewald3D reconstruction of the collected diffraction pattern and resulting MOF1 crystal structure solution.
Experimental parameters and results
| Wavelength | 1.54184 Å |
| Temperature | 100 K |
| Exposure Time | 7.5 seconds |
| Detector Distance | 31 mm |
| Resolution | 0.99 Å |
| I/σ(I) | 3.8 |
| Completeness | 90% |
| Total Time | 54 minutes |
| Crystal Data | |
| Space Group | I4₁/amd |
| Unit Cell (Å) | 11.84, 11.84, 18.98 |
| R1/Rint (%) | 11.12 / 25.21 |
| Formula | C₁₂N₁₉Cu₃ |
Example of a publishable dataset collected from a microcrystal of activated MOF2
A very fine powder of MOF2³ following thermal activation was screened in search of single crystals. Batches of material of approximately 20 microns in size were selected to search for discrete diffraction patterns originating from microcrystals (Figure 2). After confirming the structure with a WIT dataset on one batch, the microcrystal within was isolated from the powder and remounted for a longer data collection, which gave excellent results (Figure 3)
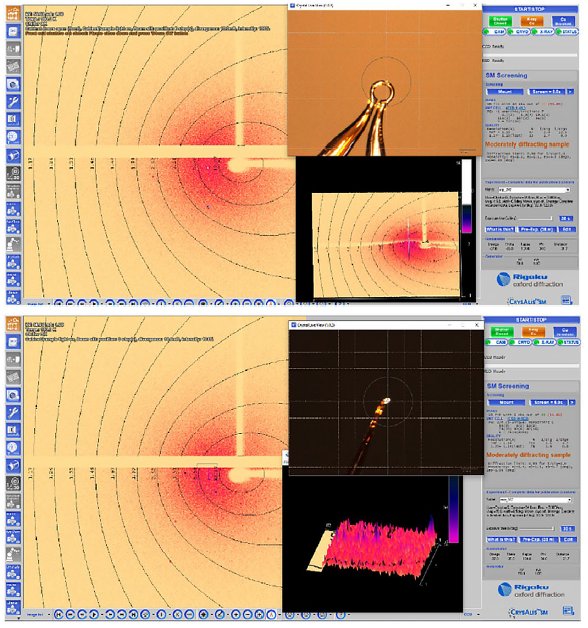
Figure 2: An example of screening results from material batches as seen in CrysAlisPro. On the top, a loop with a single microcrystal; on the bottom, a cluster of microcrystals.
Experimental parameters and results
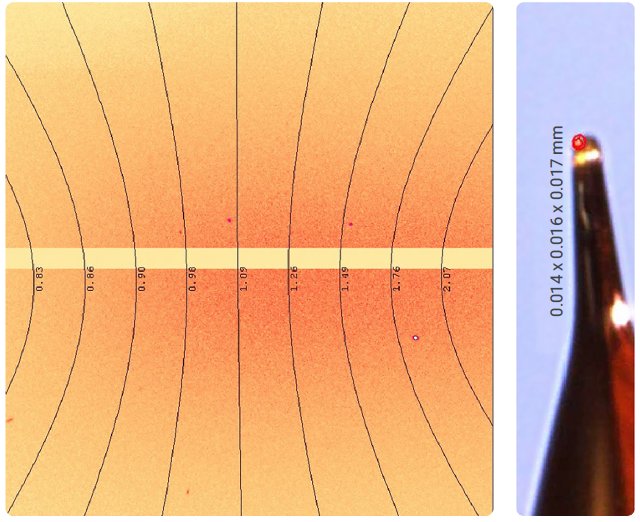
Figure 3: A view of a nylon loop with the MOF2 microcrystal and a 40-second frame.
Experimental parameters and results
| Wavelength | 1.54184 Å |
| Temperature | 100 K |
| Exposure Time(s) | 10 and 40 seconds |
| Detector Distance | 31 mm |
| Resolution | 0.84 Å |
| I/σ(I) | 21.6 |
| Redundancy | 3.1 |
| Reflections Collected | 6563 |
| Independent reflections | 2234 |
| Completeness | 100 % |
| Total Time | 26 hours 41 minutes |
The resulting dataset gave excellent publishable results with an R factor below three percent and a resolution limit beyond 0.84 Å (Figure 4).
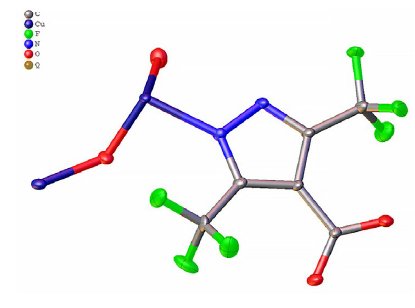
Figure 4: The asymmetric unit of the crystal structure.
Crystal data
| Space group | C2 |
| Unit cell (Å,°) | 14.3582(5) 9.0595(3) 9.3317(3) 108.811(4) |
| Formula | C₁₂Cu₃F₁₂N₄O₇ |
| Rint | 4.18 % |
| R₁ | 2.86 % |
Crystal data
To confirm activation of the MOF, a solvent mask was calculated, and 16 electrons were found in a single void within the unit cell that had a volume of 240 ų. This is consistent with the presence of only 0.1 molecules of the expected DMF solvent in the asymmetric unit. The results before and after use of a solvent mask are shown in Figure 5.
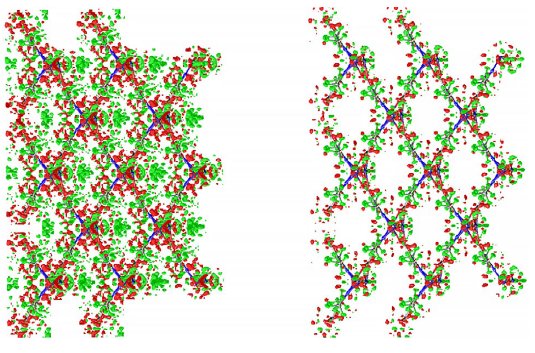
Figure 5: The MOF2 crystal framework with residual Fourier map (subsurface contour level at 0.15 eÅ⁻³) before application of solvent mask (left) and after (right).
Conclusions
The combination of a high-flux microfocus PhotonJet-S(Cu) source with the HyPix-6000HE detector is perfect for measuring diffraction from small and poorly diffracting samples due to the extremely low noise characteristics: you can count as long as you need to without dark current or noise build-up that is seen in other detectors.
The results demonstrate the capability of the XtaLAB Synergy-S to collect single crystal data from samples of less than 20 microns. The easy-to-use sample mounting and screening workflows implemented in CrysAlisPro speed up the search for suitable single crystal. This opens the door to easy structural analysis of thermally activated MOF materials.
Acknowledgements
We are grateful to Prof. Dirk Volkmer, Augsburg University, Germany for providing the MOFs materials for data collection.
References
- M. Grzywa, et al., Dalton Trans. 2012, 41, 4239-4248 DOI: 10.1039/C2DT12311H
- T. Matsumoto, et al. J. Chem. Crystallogr. 2020, 1572-8854 DOI: 10.1007/s10870-020-00867-w
- J. Fritzsche et al., Dalton Trans., 2019, 48, 15236-15246 DOI: 10.1039/c9dt02133g

Contact Us
Whether you're interested in getting a quote, want a demo, need technical support, or simply have a question, we're here to help.