Drug Product Identification
Introduction
Handheld Raman spectroscopy is well accepted as a technique for raw material and excipient identification within the pharmaceutical industry. Using the correct Raman excitation wavelength can extend its capabilities into the areas of drug substance and drug product identification.
- Identify Drug Products and Drug Substances
- Verify API Dose and Placebos
- Reduce Material Transfer
Minimize sample interference while maximizing efficiency
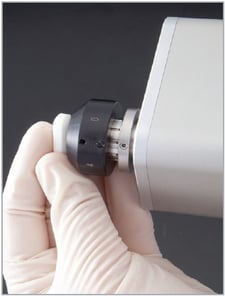
Handheld Raman is an attractive ID method because it provides a portable measurement that can distinguish different concentrations of active pharmaceutical ingredients (API) in drug product (DP) doses and placebos with little or no sample preparation. Progeny, a handheld Raman analyzer with 1064 nm excitation, is less prone to fluorescence interference typically experienced by handheld analyzers with 785 nm excitation. The advantages of using Progeny for identification can be applied to initial DP and API release testing as a secondary identification method since potency is typically determined by a primary technique such as HPLC. Handheld Raman can also be applied to in-process control testing during post packaging operations, final release testing and receipt ID testing of finished goods. This eliminates the need to send samples to an analytical laboratory and provides significant savings. As well as portability, 1064 nm handheld Raman has advantages compared to traditional ATR-FTIR and compendial wet chemical techniques. This includes reduced sample preparation, minimal instrument clean up and the removal of exposure risks of high potency APIs, because of Raman’s ability to measure through containers—such as plastic bags, thin plastic, clear glass and amber glass bottles.
Feasibility study
 A collaborative study was performed in conjunction with Pfizer Inc., Global Analytical Research and Development, by analyzing several different DP formulations of API at different loading levels using Progeny. These experiments were intended to verify whether a qualitative analysis approach, such as correlation, would suffice in the discriminatiion between similar products with different API concentration. Three sets of DP tablet and capsules with API/excipient blends with API loading—in the range of 4 - 28%—and corresponding matching placebos were analyzed (see Table 1). Placebos were investigated in this study because these particular DP samples were made for clinical trials.
Table 1: Details on the contents of each of the three sets of samples investigated.
| Compound | Dosage form material ID (DMID) |
Potency | API loading |
| Drug product—Gelatin capsule | D1200160 | 125 mg | 28% |
| Drug product—Gelatin capsule | D1200158 | 75 mg | 28% |
| Drug product—Gelatin capsule | D0401369 | 25 mg | 9% |
| Drug product—Gelatin capsule PBO capsule fill |
D1200155 | 0 mg | 0% |
| Non-film coated drug product Tablet |
D1306646 | 12.2 mg | 4% |
| Non-film coated drug product PBO |
D0904600 | 0 mg | 0% |
| Film-coated drug product tablet | D1005304 | 10 mg | 10% |
| Film-coated drug product tablet | D1306478 | 2.5 mg | 5% |
| Film-coated drug product tablet | D0904975 | 5 mg | 5% |
| Film-coated drug product tablet | D1005706 | 10 mg | 5% |
| Film-coated drug product tablet PBO |
D0904596 | 0 mg | 0% |
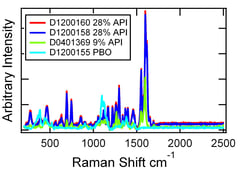 Different API loading in the capsule contents and the placebo are easily distinguished for these active compound formulations. This was demonstrated by measuring the contents of each capsule through plastic bags and adding each spectrum to Progeny’s library. Figure 1 shows the spectra from these four samples.
| Material | D1200160 28% API |
D1200158 28% API |
D0401369 9% API |
D0904600 PBO |
| D1200160 28% API |
0.95 | 0.95 | 0.70 | 0.00* |
| D1200158 28% API |
0.95 | 0.95 | 0.70 | 0.00* |
| D0401369 9% API |
0.48 | 0.49 | 0.88 | 0.07 |
| D0904600 PBO |
0.00* | 0.00* | 0.01 | 0.93 |
Table 2. Average HQI for six repeat measurements of capsule contents, standard deviation is < 0.15.
*The same percent API loading cannot be distinguished by Raman, however potency of these two capsules can be determined by size and weight.
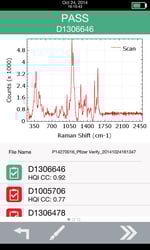
For this DP, a single potency currently exists. Clear differences are seen in the Raman spectra of the placebo and the active tablet containing 4% w/w API. The materials were measured as-is, and as was done with the capsule contents, each spectrum was added to the library and then six subsequent measurements were compared to the library. The differences between the HQI values for the 4% API tablet and the PBO are large enough that the two can be easily distinguished using a 1064nm Raman analyzer. Figure 2 shows a measurement taken by Progeny of the 4% API tablet, demonstrating correct identification and a clear Raman spectrum.
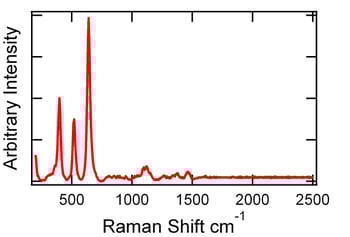
Tablets from this set of samples were not distinguishable by Raman. Strong TIO2 bands dominated the spectra. Figure 3 shows a Raman spectrum example of a film-coated tablet. Even after filing off the Opadry White (TIO2) coating, the Raman spectra were dominated by peaks from the excipients. However, the potency can be distinguished by tablet size/shape/weight.
CONCLUSION
Progeny could easily distinguish different API loadings and placebos for two of the three drug products from clinical trials investigated. For appropriate DP formulations, the use of this portable and rapid technique could be applied to in-process control checks of packaging lines and subsequent post package verification testing of DP without transferring the DPs to an analytical laboratory. Handheld Raman technology not only offers efficiency and fast data collection for final release of post-packaged DP, but also allows for an extra layer of quality to be incorporated into the post-packaging and post-package release testing, all while reducing material transfer steps and analyst exposure to high potency APIs and DPs.

Contact Us
Whether you're interested in getting a quote, want a demo, need technical support, or simply have a question, we're here to help.