Charge-density Data Collection on XtaLAB Synergy-S with HyPix 6000
Introduction
For the correct experimental determination of the charge-density distribution within crystalline structures, reliable high-resolution diffraction data are imperative. Refinement of the true, experimental charge-density requires the application of sophisticated models, like the Hansen & Coppens Multipole Model (Acta Cryst. (1978) A34, 909–921) or X-ray constrained wave functions (Acta Cryst. (2004) A60, 111-119). Only such models allow for the deconvolution of the vibrational smearing from the anisotropic atomic density or the system’s wave function, and subsequently revealing insight into the chemical properties.
The collection of such high-resolution data imposes high demands on the experimental setup. While perfect crystal quality is sometimes not achievable, the development of advanced hardware and software clears the path for novel charge-density determinations.
The Rigaku XtaLAB Synergy-S is the required fusion of high-end hardware and software, providing new possibilities for experimental charge-density determination.
Experimental
All experiments were performed using a PhotonJet-S (Mo) XtaLAB Synergy-S with HyPix-6000 detector. A suitable crystal of cytidine was selected by fast screening in a customized screening job implemented in CrysAlisPro. Employing the Experiment Strategy tool, a high-resolution diffraction experiment was planned and performed. After the data collection completed, the data processing was optimized semi-automatically. CrysAlisPro offers a wide range of options for the integration of high-quality data. These are easily accessible to the user and well documented in the online help. In order to find an optimal integration method, multiple background settings and integration profile corrections were cross-checked by using the ProfFitLoop functionality. CrysAlisPro furthermore offers a range of options for the application of an absorption correction and a weighting scheme. In this specific case, a face-indexed absorption correction and no additional weighting were applied. The data collection resulted in a high-resolution and high-quality data set (Tables 1 & 2).
Table 1: Data collection parameters
| Exposure Time | 10 and 80 s |
| Data, Unique, Parameter | 576189, 17051, 456 |
| Max. Resolution, Completeness | 0.37 Å, 100 % |
Table 2. Data Quality Parameters (all data, experimental weights were retained)
| Rint [%] | 3.2 | ρmax [eÅ⁻³] | 0.093 |
| R1 [%] | 1.10 | ρmin [eÅ⁻³] | -0.113 |
| wR2 [%] | 1.46 | Egross [e] | 7.0 |
| GOF | 2.651 | SG | P2₁2₁2₁ |
Charge-density refinement results
The structure was refined using the Hansen & Coppens Multipole approach with the software XD2016 (Volcov et.al). Non-hydrogen atoms were refined up to the hexadecapole level, while hydrogen atoms were refined to the octapole level. The minimum number of multipoles were selected for each atom site according to the local symmetry. Equivalent atom sites were constrained, amounting to a total of 94 multipole parameters. All atoms were refined with anharmonic motion parameters, following the strategy suggested by Köhler et. al. (Acta Cryst. (2019) B75, 434-441).
The refinement revealed a physically meaningful deformation density, shown in Figure 1. The refinement features extremely low R-values and overall excellent data quality indicators in Table 2. No resolution-dependent systematic errors can be observed in Figure 4 and the overall residual density is truly flat, as illustrated in Figure 2 at the level of ±0.05 eÅ⁻³, and featureless, as illustrated by the fractal dimension plot in Figure 5.
The data quality is therefore deemed very good and the measured intensities truly reflect the charge density distribution, while the differences between model
and data are the result of statistical, experimental errors. The model of the molecular charge-density distribution is therefore fit for the analysis in the QTAIM Approach (Chem. Rev. (1991) 91, 5, 893-928).
In Figure 3, one result of such an analysis is presented as the molecular graph, representing the course of all Bond Paths and the positions of all Critical Points. By the properties of the density distribution at the critical points, these can be further characterized in order to get a holistic characterization of intra-molecular and intermolecular interactions.
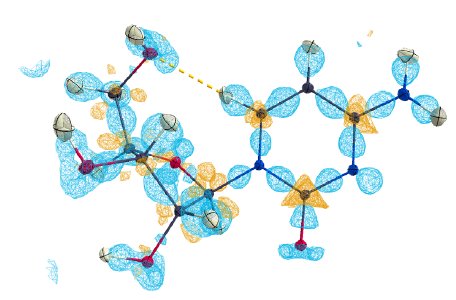
Figure 1: Deformation density of cytidine at 0.15 eÅ⁻³.
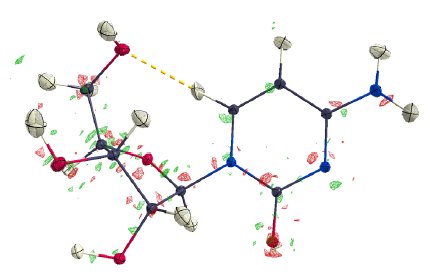
Figure 2: Difference density of cytidine at 0.05 eÅ⁻³.
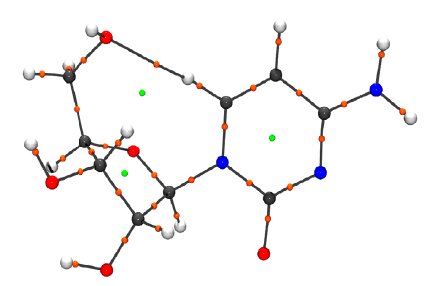
Figure 3: Molecular graph, featuring Bond Paths (black), Bond Critical Points (orange) and Ring Critical Points (green) according to QTAIM analysis.
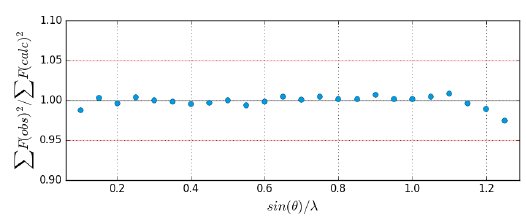
Figure 4: Resolution-dependent scaling plot.
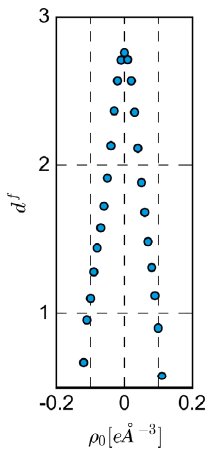
Figure 5: Fractal dimension df versus residual density ρ₀. Acta Cryst. (2015). A71, 203-211.

Contact Us
Whether you're interested in getting a quote, want a demo, need technical support, or simply have a question, we're here to help.