Determining Structure of Volatile Compounds with the Crystalline Sponge Method
Introduction
The crystalline sponge method¹ presents new possibilities for the determination of structure by single crystal X-ray diffraction analysis. By utilizing the crystalline structure of a porous host material, guest analytes may be absorbed by into the pores of the host and thus have the crystallinity of the host imposed upon them. This approach enables the structure determination of analytes previously inaccessible to X-ray crystallography such as liquids, gases and low-availability compounds.
In the case of this application note, the crystalline sponge method was applied to gas phase analytes. In many industries, detection and identification of an analyte in the gas phase analytes is the only possibility and typically precludes direct observation of 3D structure. To demonstrate the capabilities of this technique, several odors were captured with crystalline sponges and their structures determined.
Experimental
For these experiments, the crystalline sponge host used was that identified in the 2013 paper by Fujita et al¹ in which the crystalline sponge method was first introduced. The sponge is a crystalline metal-organic framework (MOF) in which the porous cavities are initially filled with cyclohexane molecules. In a typical crystalline sponge experiment, the sponge is also initially kept under solvent and a solution containing the analyte is introduce, mixing with the cyclohexane. Over time, the solvent evaporates, analyte concentration increases and analyte molecules enter the pores of the sponge, displacing the cyclohexane.
For a gas phase analyte however, the soaking process differs slightly in that the crystalline sponge must first be removed from solvent in order to be exposed it to the analyte. Under these circumstances a volatile solvent would quickly leave the sponge lattice, in the process destroying the sponge.
In order to overcome this, a less volatile solvent must be used which remains in the lattice but allows analyte molecules to enter. Trans-decaline has a boiling point of 185°C higher than the 80.75°C boiling point of cyclohexane making it a suitable solvent.
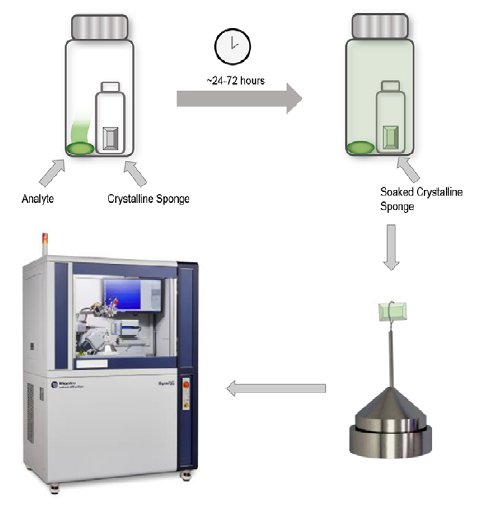
Following solvent exchange, the trans-decaline containing host may be removed from the solvent and exposed to the gas phase analyte. The methodology used in this application note was to seal the crystal sponge inside a larger vial containing a source of the gas phase analyte.
Five different analytes were soaked into sponges and their structures determined via X-ray crystallography on a Rigaku XtaLAB Synergy-S diffractometer with a HyPix-6000HE hybrid photon counting detector.
Results
Sample 1: Fresh wasabi
Wasabi is well-known for its sharp odor and taste making it an interesting test candidate for gas phase structure determination. A small sample of commercially available wasabi was placed into a vial with a crystalline sponge using the method previously described. Soaking was allowed to proceed for approximately 1 day after which the structure was analyzed.
The result clearly shows the structure of the principle aroma molecule, allyl isosulfocyanate, a compound with a melting point of -102°C, present within the lattice.
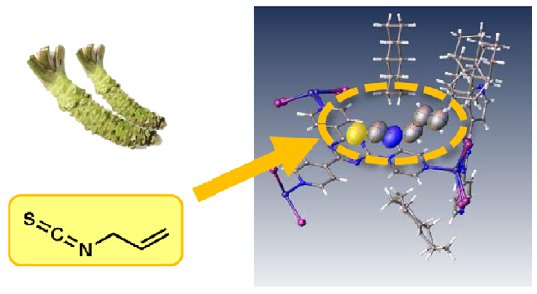
Figure 1: Fresh wasabi.
Sample 2: Garlic
Another food item commonly associated with a strong odour, garlic, was tested. In this case the result shows the aroma molecule, diallyl sulfide, was clearly present along with other sulfur compounds.
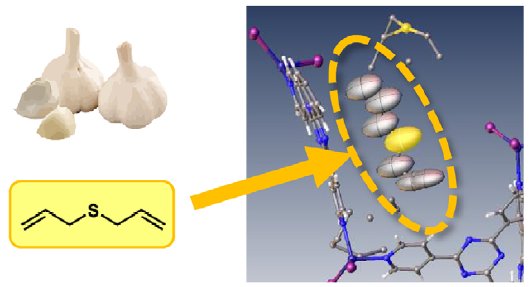
Figure 2: Garlic.
Sample 3: Dishwashing / washing up liquid
Many common household items contain fragrances including detergents for washing dishes. A lime-scented detergent was selected for an experiment to try and capture the various molecules responsible for the scent. The structural result clearly showed D-limonene trapped within the lattice. It is notable that other aroma molecules known to be present in the sample were not found in the structure. This indicates a higher affinity or selectivity of this sponge material for D-limonene.
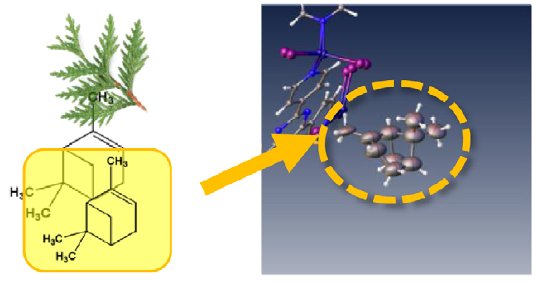
Figure 3: Dishwashing/washing up liquid.
Sample 4: Cypress oil
Essential oils are concentrated plant extracts typically of aromatic species. For instance, cypress oil is extracted from the cypress tree and contains a large amount of pinene. After soaking the sponge in cypress oil vapor for one day, the structure of α-pinene was observed in the crystal lattice.
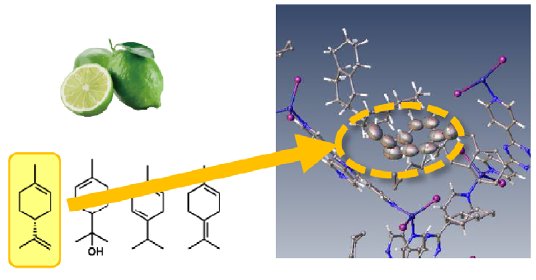
Figure 4: Cypress oil.
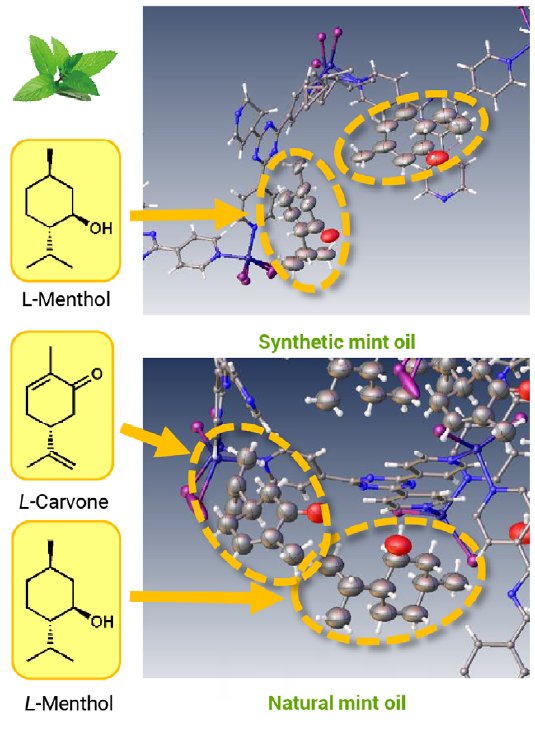
Sample 5: Peppermint oil
Peppermint oil is generally available from either natural or synthetic sources. For this experiment two different types primarily synthetic and primarily naturally sourced peppermint oil. The experiment identified only menthol in the former case but both carvone and menthol were identified in the latter. This experiment showed through the presence of carvone that the naturally sourced peppermint oil was comprised of both peppermint and spearmint extracts.
Conclusions
The results show that identification of the structure of gas phase molecules is entirely possible using the crystalline sponge method on home-lab instrumentation. In some cases structures were obtained from molecules normally only found in the gas phase, and in others identification of molecular composition was possible. The technique typically involves detecting small differences in intensities in the diffraction pattern caused by the low occupancy often disordered guest against the dominating, highly crystalline sponge lattice. Detecting these differences requires high quality data from extremely stable X-ray sources and highly sensitive and accurate detectors. The XtaLAB Synergy-S addresses both of these points using internally water cooled microfocus X-ray sources for extremely stable beam flux, and hybrid photon counting detectors for accurate photon counting without readout or dark noise.
The results shown here are also published in the Rigaku Journal.²
References
[1] Y. Inokuma, S. Yoshioka, J. Ariyoshi, T. Arai, Y. Hitora, K. Takeda, S. Matsunaga, K. Rissanen and M. Fujita: Nature, 495, 461–466 (2013).
[2] H. Sato, A. Yamano, Rigaku Journal, 35(1), (2019).

Contact Us
Whether you're interested in getting a quote, want a demo, need technical support, or simply have a question, we're here to help.