Superior Data Quality Achieved with the XtaLAB Synergy-i, Microfocus Mo source
Introduction
Mo Kα radiation is ideal for evaluating large crystal samples, crystals that contain several heavy atoms and crystal samples that are densely packed with heavy atoms. Some examples of such crystals include: minerals, metal clusters and other inorganic materials like perovskites. By studying these sample types using Mo Kα radiation, it is possible to reduce absorption effects and achieve better data quality overall. In addition to studying highly absorbing samples, it is also possible to obtain high-resolution datasets using Mo Kα radiation and perform charge density measurements. Through sophisticated charge density refinements, it is possible to determine the bond connectivity and electron placement for a particular crystal structure in more detail.
The XtaLAB Synergy-i (Figure 1) is a cutting-edge diffractometer equipped with the latest-technology detector, optimized for its small pixel size and sensitivity, and can be configured with up to two bright microfocus sealed tube sources. The Mo microfocus source has its own benefits, and a typical data collection on an organometallic crystal is discussed herein.
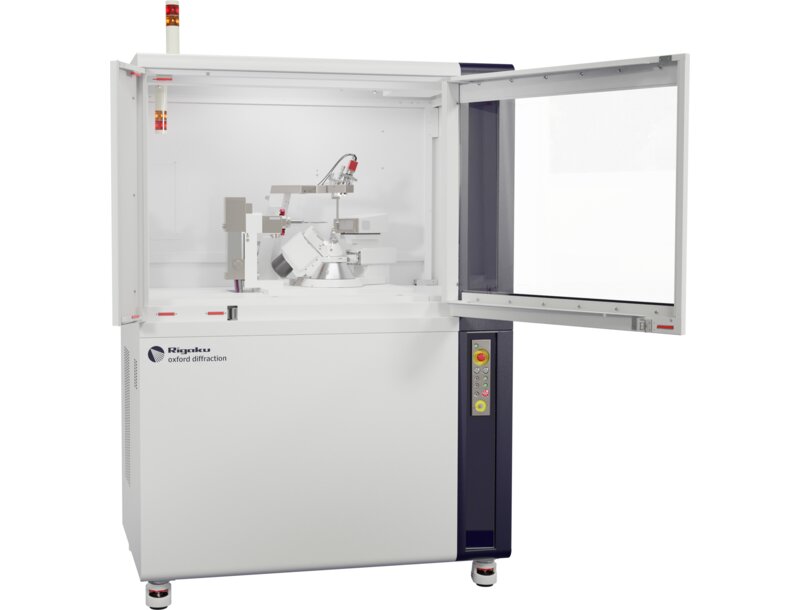
Figure 1: The XtaLAB Synergy-i.
Experimental
An organometallic complex containing a first-row transition element was mounted on a nylon loop (Figure 2) and a standard dataset for publication purposes was collected. The data collection details are shown in Table 1.
Table 1: Data collection details.
| Crystal-to-detector distance | 40 mm |
| Exposure time | 10 seconds |
| Total collection time | 1 hour 48 minutes |
| Scan width / No. of frames | 0.5° / 640 |
| Completeness | 99.9% (0.83 Å) |
| Average I/σ(I) | 40.0 |
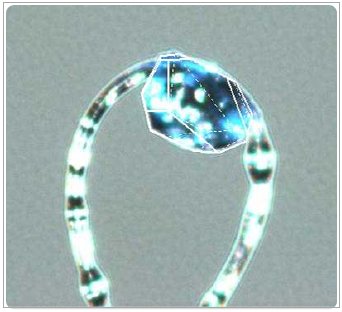
Figure 2: Face-indexed organometallic crystal (0.26 × 0.18 × 0.15 mm).
Data collection results
Figure 3 illustrates a typical diffraction pattern measured on the XtaLAB Synergy-i with the HyPix-Bantam detector. High-intensity reflections can be detected beyond a resolution of 0.83 Å.
The data was processed using the CrysAlisPro software package, which produced an excellent Rint value. CrysAlisPro also contains powerful, easy-to-use tools for face-indexing that makes it easy to apply face-indexed absorption correction models to every set of data collected using this instrument.
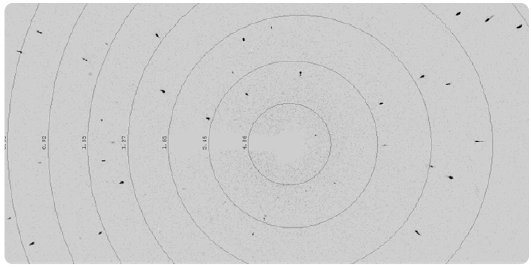
Figure 3: Diffraction image.
Table 2: Crystal data and refinement statistics.
| Chemical formula | M₂C₁₃C1₂H₂₀O₂₂ |
| Space group | Monoclinic, P2₁/c |
| a (Å), α (°) | 10.103(1), 90 |
| b (Å), β (°) | 10.8119(3), 142.77(3) |
| c (Å), γ (°) | 18.237(2), 90 |
| V (Å3) / Z | 1205.3(8) / 2 |
| Rint [merged data] | 2.17% |
| R₁ [merged data] | 3.51% |
| Largest residual peak/hole | 0.44 / -0.75 |
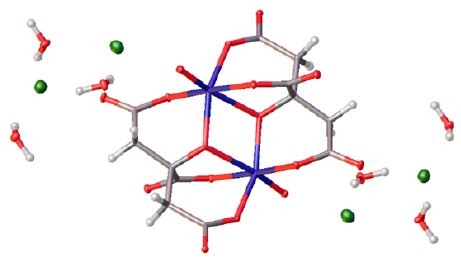 Figure 4: Organometallic structure.
Conclusion
Publishable results were obtained from this sample in a reasonable time frame, which can be attributed to the cutting-edge technology of the of the XtaLAB Synergy-i. The high flux of the Mo microfocus source, the true digital photon counting technology of the detector, the efficient 4-circle Kappa goniometer and the all-important CrysAlisPro software are all responsible for the superior data quality.

Contact Us
Whether you're interested in getting a quote, want a demo, need technical support, or simply have a question, we're here to help.