Treatment of Modulated Structures in CrysAlisᴾʳᵒ
A five-dimensional incommensurate composite structure
Modulated structures are a real test of a single crystal diffractometer. The presence of strong/intense Bragg reflections alongside weaker satellite peaks means that, for successful characterization, it is compulsory to have the following:
- A sensitive low-noise detector with high dynamic range, such as a Rigaku Oxford Diffraction CCD or HPAD, to get accurate intensity measurements on even the weakest satellite peaks.
- A powerful indexing and data reduction software package like CrysAlisPro to easily index the cell and multidimensional, multi-order satellite peaks, as well as provide good results from data processing for solution and refinement in programs such as Jana2006¹.
Rigaku Oxford Diffraction’s sealed tube systems are an excellent match for conducting research on these materials.
A synthetic tin-selenium member of the cylindrite structural family has a triclinic crystal structure composed of two alternating layer types, (Q) and (H), both with a pronounced one-dimensional modulation and with a non-commensurate layer match in two dimensions¹. The combination of modulation and incommensurate layers gives rise to a complicated diffraction pattern.
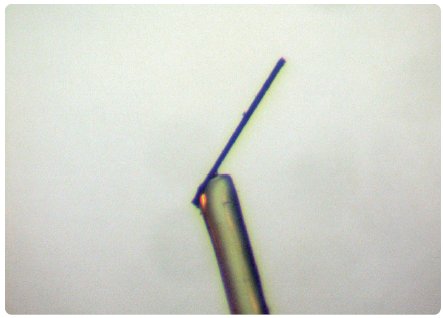
Figure 1: Very thin needle crystal mounted on a glass fiber.
Experimental
The crystal, a very thin needle, was measured using a Rigaku Oxford Diffraction Xcalibur platform with a Mo source (0.5 mm collimator) and a Sapphire2 detector. Due to the close proximity of diffraction spots, 1x1 detector binning was used together with an omega scan width of 0.3º on the detector. Data was collected to a resolution of 0.8 Å. CrysAlisPro has many features that enable difficult indexation of the diffraction data. For example, in this case the classical thresholding method together with background subtraction was used to increase the detection of satellites.
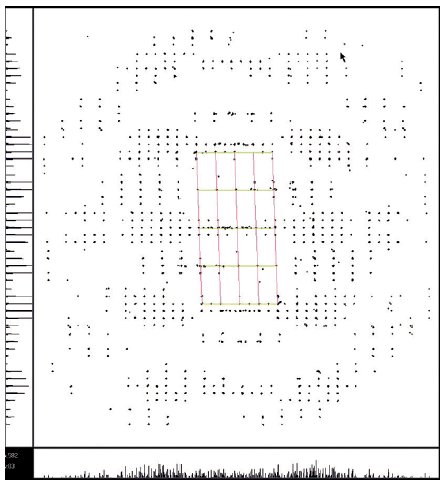
Figure 2a: View of reciprocal space along c*.
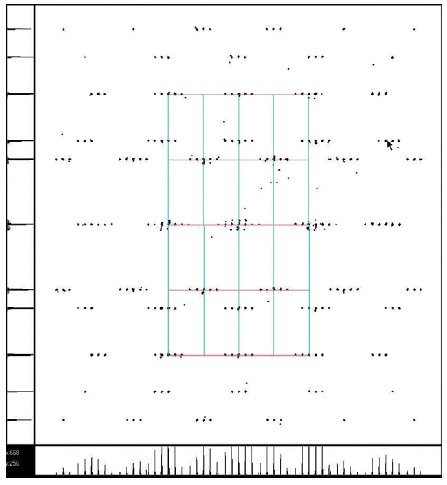
Figure 2b: View of reciprocal space along a*.
A view along c* of the subsystem (H) shows that satellites exist to very high order, and that the sample has a composite character (Fig 2a). The view along common axis a* reveals the complexity of the diffraction pattern (Fig 2b).
After identifying the main reflections of both subsystems, the q-vector was determined for the 1D modulation subsystem (H) using the q-vector overlay window in CrysAlisPro (Fig 3). First-order satellites were refined precisely. Higher-order satellites were then refined and the data set reprocessed with the help of 3D Profile Analysis. In CrysAlisPro the resulting peak table contained precise positions of the spots belonging to the subsystem (H). Refinement of q-vector, cell parameters and instrument model against this profile fit peak table yielded yet more precise values, which were fixed during data reduction. The same procedure was applied for the incommensurate 2D layer subsystem (Q), where fixing of all parameters obtained from the profile fit peak table was even more important due to the weaker reflections of this subsystem.
As the crystal was an extremely thin needle with a high absorption co-efficient (μ=65 cm-1), the face-indexing function in CrysAlisPro was combined with an analytical absorption correction using ABSPACK. Frame scaling was done after multi-scan absorption correction, thus a flat graph of frame scaling could confirm validity of the absorption correction.
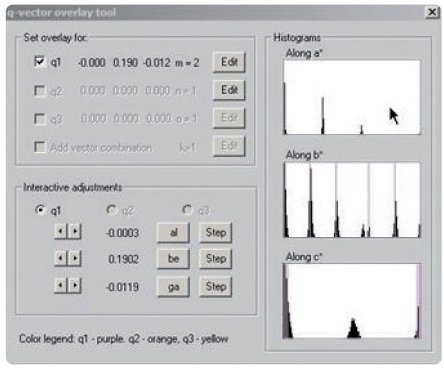
Figure 3: q-vector overlay tool in CrysAlisPro.
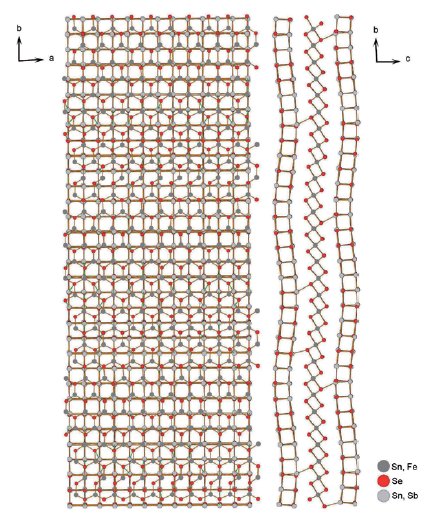
Figure 4: Overall structure demonstrating wave-like modulation parallel to b’.
CrysAlisPro allows users to output data in hklm, hklmn, hklmno and other more complex formats. The data is then fully compatible with Jana, the most commonly used software package for modulated structure refinement [1]. CrysAlisPro includes a convenient shortcut link that opens the data in Jana, if the program is installed.
Results
The pseudo-tetragonal (Q) subsystem has lattice parameters a = 5.969(2) Å, b = 6.004(1) Å, and the layer-stacking vector c = 12.238(1) Å, α = 87.98(4)º,
β = 83.14(3)º, and γ = 90.01(4)º. The pseudo-hexagonal (H) subsystem is a single-octahedral MeSe2 layer with a = 3.831(1) Å, b = 6.580(3) Å, c = 12.151(5) Å,
α = 87.79(4)º, β = 90.59(3)º, and γ = 89.99(3)º; the a and b vectors of the two subsystems are parallel; the c vectors diverge. The transversal wave-like modulation has the wave-normal parallel to b, so that the modulation vector q is 0.0001 a* + 0.1921(4) b* - 0.0119(3) c* in terms of the pseudo-hexagonal subsystem (Fig 4). Further details of the structure are discussed in the paper [2].
References
[1] Petricek, V., Dusek, M. & Palatinus, L. (2006). Jana2006. The crystallographic computing system. Institute of Physics, Praha, Czech Republic.
[2] Makovický, E., Petříček, V., Dušek, M. & Topa, D.(2008). Am. Mineral. 93, 1787–1798.
Acknowledgements
We would like to thank Emil Makovický (University of Copenhagen)*, Václav Petříček and Michal Dušek (Czech Academy of Sciences, Prague)* and Dan Topa (University of Salzburg)* for contributing data, analysis and text used in this application note.
* correct at time of study

Contact Us
Whether you're interested in getting a quote, want a demo, need technical support, or simply have a question, we're here to help.