Background
An amorphous substance is more unstable compared with the crystalline substance; so it easily transfers to the crystalline substance due to various external causes. In pharmaceutical products it is well known that differences in the degree of crystallization of a drug substance affects physical and chemical stability and resolvability more than the crystalline polymorphism of the substance. For this reason, it is necessary to evaluate the amorphous component in a pharmaceutical product quantitatively.
As a method for quantifying the amorphous substance in the crystalline substance, X-ray diffraction and thermal analysis (thermally-stimulated current measurement method) are available for use. The quantitative analysis of a low-concentration amorphous substance can be performed from the intensity ratio between the peak intensity generated from the crystalline component and the hollow intensity generated from the amorphous component in the X-ray diffraction measurement method, and from the depolarization spectrum accompanied with the glass transformation of the amorphous substance in the thermally-stimulated current measurement method, respectively.
Investigation
Terfenadine, which has been used as an antiallergic agent, becomes amorphous under pressure. A terfenadine sample was smashed using a crusher for 30 minutes to generate a reference sample with assumed 0% degree of crystallinity. It was mixed with an uncrushed sample to create a terfenadine sample with an arbitrary degree of crystallinity.
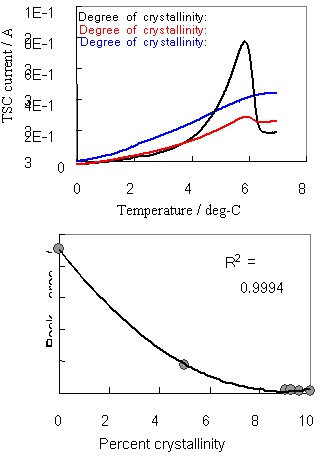
Figure 1 shows the profiles and calibration curve obtained from the X-ray diffraction measurement made on Rigaku's Ultima IV multipurpose diffraction system. Figure 2 shows the overlapped profiles and the calibration curve obtained from the thermally-stimulated current measurement method. As a result, it is found that the quantitative analysis of a low concentration amorphous substance can be performed using the two methods.