Background:
Zeolites are commonly used in a vast variety of industrial applications, including environmental clean-up, petroleum cracking, filtering/separations and cation exchange. These materials can be mined from natural sources or can be commercially synthesized. A basic structure of five silicon and aluminum tetrahedra result in a cage-like structure with large open spaces or "pores". These pores have charged regions which attract or exchange cations.
Investigation:
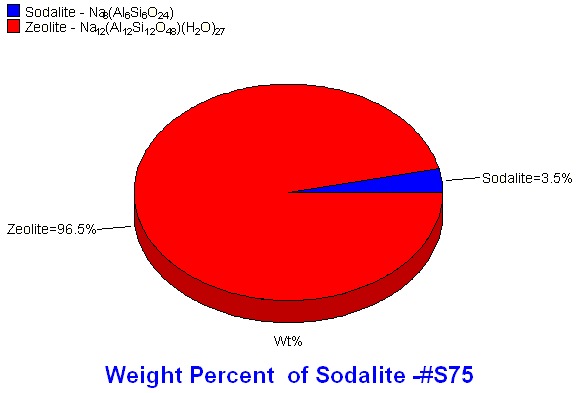
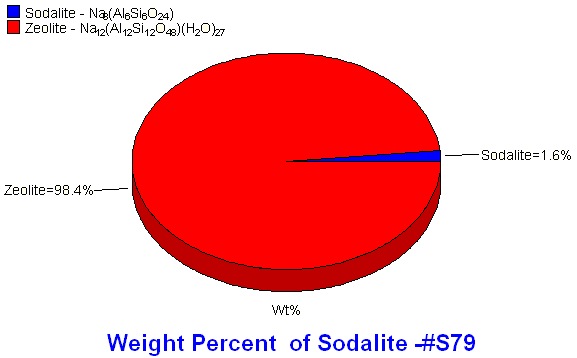
For effective activity and specific cation incorporation, the zeolites need to be very specific and pure. X-ray diffraction is the preferred method for impurity identification (phase identification) and quantification.
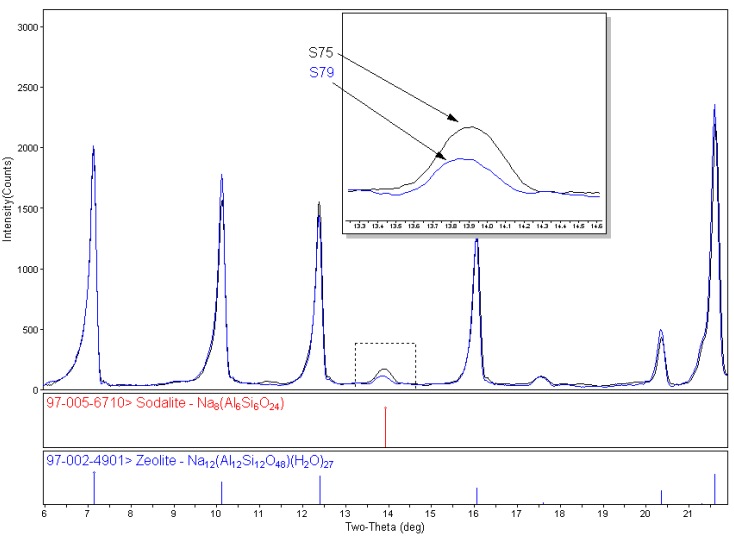
Generally for RIR, the entire pattern does not need to be integrated or profile fit, only the region containing the strongest intensity peaks from all phases. Profile fitting provides area information, both of individual peaks and the entire pattern. After profile fitting, the peak areas are assigned to the individual phases present by color. Easy Quant, the RIR quantitative feature in MDI's Jade software, uses the peak area information along with the phase identification to calculate the weight percents of each identified phase.