Background
New drug discoveries not only help secure the financial health of pharmaceutical companies, they are paramount to the management of disease and the furtherance of human health and wellness. In the synthesis of new compounds for drug efficacy studies, researchers may be impacted by experimental, budgetary or other constraints as to the quantity of suitably pure material that can be produced in the laboratory for subsequent evaluation. These sample size limitations complicate chemical characterization of the synthetic products since very little material can be sacrificed for analysis.
MicroCarry
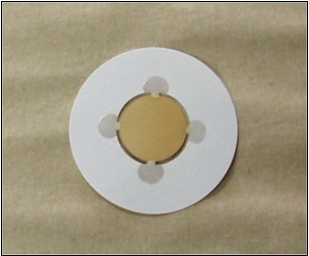
Rigaku's patented Microcarry and Ultracarry filters offer a uniquely fast, convenient and cost-effective means of conducting reliable elemental analyses of minute quantities of these drug candidates. The high detection sensitivities achievable with this sample preparation method often permit analyses to be conducted on lower cost benchtop WDXRF models with reduced utility and maintenance requirements such as Rigaku's high performance 200 Watt Supermini200 WDXRF spectrometer.
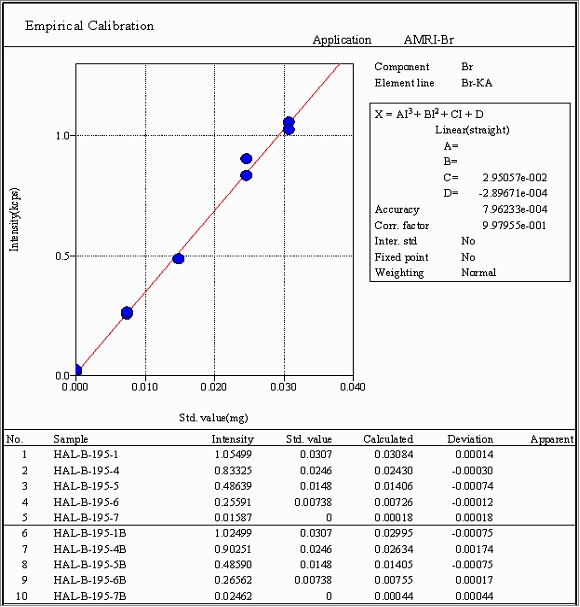
The WDXRF calibration curve shown in Figure 1 was constructed by pipetting microgram quantities of 2-bromo-5-aminothiazole monohydrobromide (Sigma-Aldrich, 61.48 mass% Br theoretical) from a 1.00 mg/mL aqueous stock solution onto the center analysis region of Microcarry filters. Measurement of bromine x-ray emission intensity from duplicate preparations of these filters using the Supermini200 gave a correlation coefficient of 0.998 and accuracy (RMS deviation) of 0.8 micrograms when calibrating in a Br loading range of 0 - 31 micrograms.
Two "prediction samples" prepared in duplicate per Table 1 from samples of arecoline hydrobromide (Sigma-Aldrich, 33.84 mass% Br theor.) and tetrabutylammonium bromide (Sigma-Aldrich, 24.79 mass% Br theor.) were analyzed against the WDXRF calibration curve to determine bromine loadings for method validation purposes, the results of which are presented in Table 2. One of the Microcarry filters prepared from these samples was analyzed ten different times and yielded the repeatability statistics of Table 3.
|
|
|
|
|
|
|
|
| HAL-B-105-2 |
|
|
|
|
|
|
| HAL-0B-195-3 |
|
|
|
|
|
|
|
|
|
|
| HAL-B-105-2 |
|
|
| HAL-B-195-2B (duplicate preparation) |
|
|
| Average = 0.018 | ||
| HAL-B-195-3 |
|
|
| HAL-B-195-2B (duplicate preparation) |
|
|
| Average = 0.0120 | ||
|
|
|
|
|
|
|
|
|
|
|
|
|
|
|
|
|
|
|
|
|
|
|
|
|
|
|
|
|
|
|
|
|
| Mean |
|
| Minimum |
|
| Maximum |
|
| Range |
|
| Std. Dev |
|
| RSD (%) |
|
Coupled with the Supermini200, the Microcarry method affords a bromine detection limit of 0.2 micrograms (Table 4) when using a 60 second counting time at peak and background locations. Analysis of the two prediction samples demonstrates the high accuracy potential of the method and its applicability to bromine compounds of widely differing chemical composition. Relative measurement errors of just 3.4% and 0.84% were indicated for arecoline hydrobromide and tetrabutylammonium bromide, respectively, when comparing WDXRF results to the theoretical Br content of the two materials. Replicate analyses of the former sample indicate bromine measurements can be made with high precision as evidenced by a 0.85% RSD.
|
|
|
|
|
33892 |
|
|
|
|
|
|
|
|
|
Formula: Lower limit of detection (LLD) in mg = 3/m x √(Rb-tb), where
- m = sensitivity in counts/second per mg
- Rb = count rate at background in counts/sec
- tb = time at background in seconds