Background
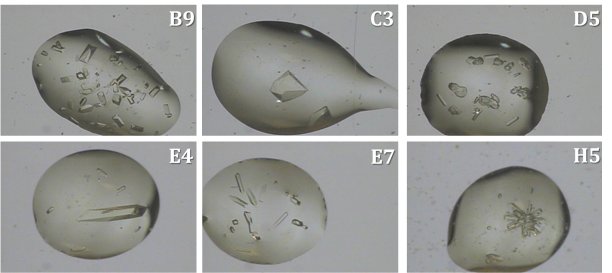
Bovine pancreas trypsin was screened for crystallization conditions using the Rigaku Reagents Wizard Classic 1 & 2 screens in a MiTeGen In Situ-1™ crystallization plate. Following an incubation period at 18°C, the plate was loaded into the XtalCheck hardware, which was mounted on a XtaLAB MM007-HF diffraction system configured with the MicroMax™-007 HF microfocus rotating anode, a VariMax HF optic and a PILATUS3 R 200K Hybrid Photon Counting detector. A series of wells were imaged using the XtalCheck software and the existing camera system on the XtaLAB MM007-HF system. Several crystal objects were identified from captured images for further X-ray screening. The figure below shows drop images for six conditions showing crystals of varying morphologies and sizes.
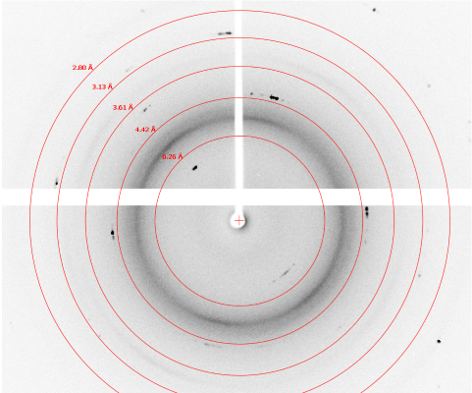
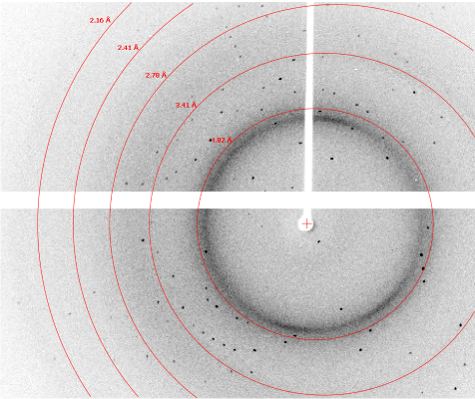
Crystals from several wells were selected for diffraction screening. Of these, most exhibited protein-like diffraction up to 1.7 Å with exposure times in the range of 5 – 15 seconds per 0.25°. A diffraction image from a crystal from well F9 and H5 are shown below. The diffraction image for the crystal in F9 exhibits sporadic diffraction peaks that are more consistent with salt crystals. The diffraction image for the crystal in well H5 contains many reflections across all resolution levels, which is more consistent with protein diffraction. Crystal morphology alone does not allow identification of salt versus protein; however, X-ray diffraction screening does. The XtalCheck allows one the advantage of being able to collect diffraction images on crystals in situ to quickly identify whether crystal objects are salt or protein and to benchmark diffraction resolution prior to cryo-freezing while saving valuable time.